
|
Valoración DCF de Beam Therapeutics Inc. (BEAM) |
Completamente Editable: Adáptelo A Sus Necesidades En Excel O Sheets
Diseño Profesional: Plantillas Confiables Y Estándares De La Industria
Predeterminadas Para Un Uso Rápido Y Eficiente
Compatible con MAC / PC, completamente desbloqueado
No Se Necesita Experiencia; Fáciles De Seguir
Beam Therapeutics Inc. (BEAM) Bundle
¿Busca determinar el valor intrínseco de Beam Therapeutics Inc.? Nuestra calculadora DCF de haz integra datos del mundo real con extensas características de personalización, lo que le permite refinar sus pronósticos y mejorar sus estrategias de inversión.
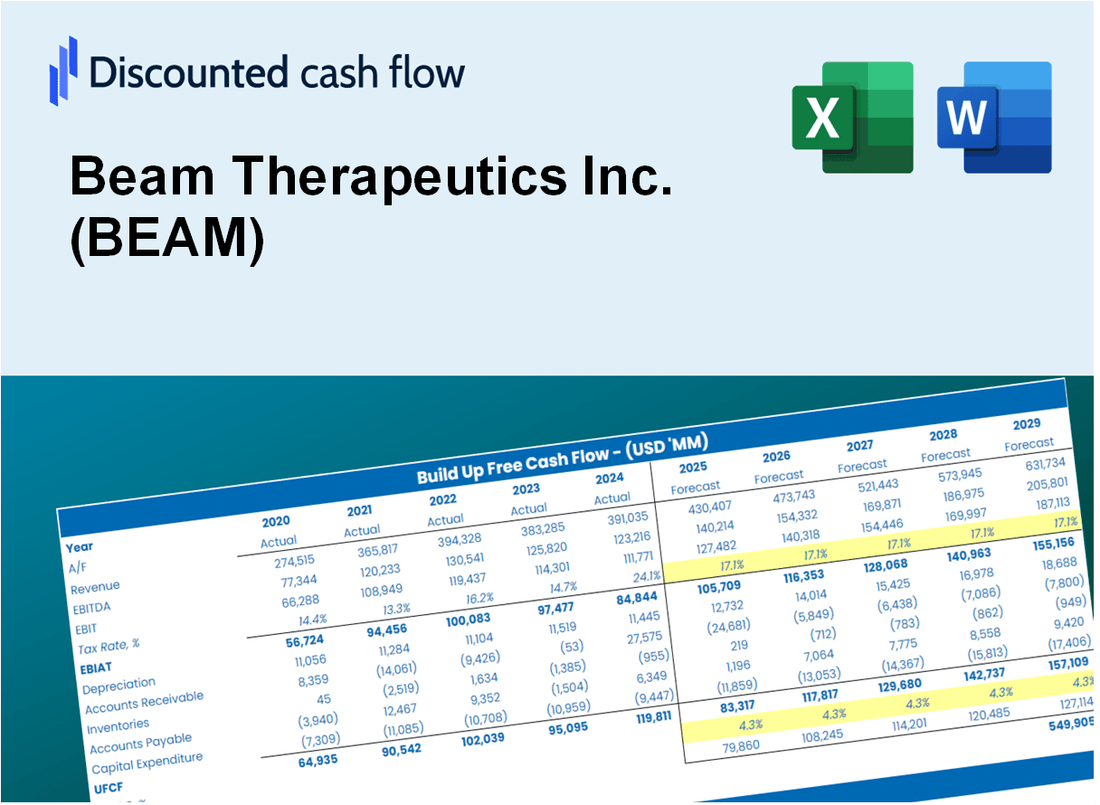
Discounted Cash Flow (DCF) - (USD MM)
| Year | AY1 2020 |
AY2 2021 |
AY3 2022 |
AY4 2023 |
AY5 2024 |
FY1 2025 |
FY2 2026 |
FY3 2027 |
FY4 2028 |
FY5 2029 |
|---|---|---|---|---|---|---|---|---|---|---|
| Revenue | .0 | 51.8 | 60.9 | 377.7 | 63.5 | 84.8 | 113.3 | 151.4 | 202.2 | 270.2 |
| Revenue Growth, % | 0 | 215916.67 | 17.51 | 520.01 | -83.18 | 33.58 | 33.58 | 33.58 | 33.58 | 33.58 |
| EBITDA | -128.0 | -230.1 | -324.3 | -147.0 | -393.6 | -74.5 | -99.5 | -132.9 | -177.5 | -237.1 |
| EBITDA, % | -533437.5 | -443.76 | -532.39 | -38.91 | -619.73 | -87.78 | -87.78 | -87.78 | -87.78 | -87.78 |
| Depreciation | 4.7 | 7.5 | 14.1 | 29.5 | 21.9 | 30.5 | 40.8 | 54.5 | 72.8 | 97.2 |
| Depreciation, % | 19729.16 | 14.37 | 23.22 | 7.82 | 34.52 | 35.99 | 35.99 | 35.99 | 35.99 | 35.99 |
| EBIT | -132.8 | -237.5 | -338.5 | -176.5 | -415.6 | -75.8 | -101.3 | -135.3 | -180.7 | -241.4 |
| EBIT, % | -553166.66 | -458.13 | -555.61 | -46.73 | -654.25 | -89.35 | -89.35 | -89.35 | -89.35 | -89.35 |
| Total Cash | 299.7 | 965.6 | 1,078.1 | 1,189.9 | 850.7 | 84.8 | 113.3 | 151.4 | 202.2 | 270.2 |
| Total Cash, percent | 1.2 | .0 | .0 | .0 | .0 | .0 | .0 | .0 | .0 | .0 |
| Account Receivables | .0 | 300.0 | .0 | .0 | .0 | 17.0 | 22.7 | 30.3 | 40.4 | 54.0 |
| Account Receivables, % | 0 | 578.66 | 0 | 0 | 0 | 20 | 20 | 20 | 20 | 20 |
| Inventories | .0 | .0 | .0 | .0 | .0 | .0 | .0 | .0 | .0 | .0 |
| Inventories, % | 0 | 0 | 0 | 0 | 0 | 0 | 0 | 0 | 0 | 0 |
| Accounts Payable | 6.3 | 7.5 | 9.0 | 1.6 | 3.9 | 23.0 | 30.8 | 41.1 | 54.9 | 73.4 |
| Accounts Payable, % | 26308.33 | 14.42 | 14.82 | 0.42811 | 6.09 | 27.15 | 27.15 | 27.15 | 27.15 | 27.15 |
| Capital Expenditure | -16.4 | -46.8 | -49.0 | -33.7 | -8.9 | -49.8 | -66.6 | -88.9 | -118.8 | -158.7 |
| Capital Expenditure, % | -68154.17 | -90.29 | -80.35 | -8.93 | -14.08 | -58.73 | -58.73 | -58.73 | -58.73 | -58.73 |
| Tax Rate, % | -0.01035298 | -0.01035298 | -0.01035298 | -0.01035298 | -0.01035298 | -0.01035298 | -0.01035298 | -0.01035298 | -0.01035298 | -0.01035298 |
| EBITAT | -132.8 | -237.5 | -342.5 | -178.3 | -415.6 | -75.8 | -101.3 | -135.3 | -180.7 | -241.4 |
| Depreciation | ||||||||||
| Changes in Account Receivables | ||||||||||
| Changes in Inventories | ||||||||||
| Changes in Accounts Payable | ||||||||||
| Capital Expenditure | ||||||||||
| UFCF | -138.1 | -575.7 | -75.8 | -189.9 | -400.4 | -92.9 | -125.0 | -167.0 | -223.1 | -298.0 |
| WACC, % | 13.34 | 13.34 | 13.34 | 13.34 | 13.34 | 13.34 | 13.34 | 13.34 | 13.34 | 13.34 |
| PV UFCF | ||||||||||
| SUM PV UFCF | -588.4 | |||||||||
| Long Term Growth Rate, % | 2.00 | |||||||||
| Free cash flow (T + 1) | -304 | |||||||||
| Terminal Value | -2,680 | |||||||||
| Present Terminal Value | -1,433 | |||||||||
| Enterprise Value | -2,021 | |||||||||
| Net Debt | -121 | |||||||||
| Equity Value | -1,900 | |||||||||
| Diluted Shares Outstanding, MM | 82 | |||||||||
| Equity Value Per Share | -23.09 |
What You Will Get
- Editable Excel Template: A fully customizable Excel-based DCF Calculator featuring pre-filled real BEAM financials.
- Real-World Data: Historical data and forward-looking estimates (as indicated in the yellow cells).
- Forecast Flexibility: Modify forecast assumptions such as revenue growth, EBITDA %, and WACC.
- Automatic Calculations: Quickly observe the effects of your inputs on Beam Therapeutics’ valuation.
- Professional Tool: Designed for investors, CFOs, consultants, and financial analysts.
- User-Friendly Design: Organized for clarity and ease of use, complete with step-by-step guidance.
Key Features
- 🔍 Real-Life BEAM Financials: Pre-filled historical and projected data for Beam Therapeutics Inc.
- ✏️ Fully Customizable Inputs: Adjust all critical parameters (yellow cells) like WACC, growth %, and tax rates.
- 📊 Professional DCF Valuation: Built-in formulas calculate Beam’s intrinsic value using the Discounted Cash Flow method.
- ⚡ Instant Results: Visualize Beam’s valuation instantly after making changes.
- Scenario Analysis: Test and compare outcomes for various financial assumptions side-by-side.
How It Works
- Step 1: Download the Excel file.
- Step 2: Review pre-entered Beam Therapeutics Inc. (BEAM) data (historical and projected).
- Step 3: Adjust key assumptions (yellow cells) based on your analysis.
- Step 4: View automatic recalculations for Beam Therapeutics Inc. (BEAM)’s intrinsic value.
- Step 5: Use the outputs for investment decisions or reporting.
Why Choose Beam Therapeutics Inc. (BEAM) Calculator?
- Precision: Utilizes real Beam Therapeutics financial data for reliable results.
- Adaptability: Allows users to easily adjust and test various inputs.
- Efficiency: Eliminate the need to create a financial model from the ground up.
- Expert-Level: Crafted with the accuracy and functionality expected by industry professionals.
- Intuitive: Simple to navigate, making it accessible for users with varying levels of financial expertise.
Who Should Use Beam Therapeutics Inc. (BEAM)?
- Investors: Gain insights into innovative gene editing technologies for informed investment choices.
- Biomedical Researchers: Utilize cutting-edge research data to enhance your studies in genetic therapies.
- Healthcare Consultants: Adapt findings for client strategies in biotechnology and therapeutic development.
- Science Enthusiasts: Explore the advancements in genetic medicine and their implications for the future.
- Educators and Students: Leverage the company's research as a resource for learning in biotechnology courses.
What the Template Contains
- Operating and Balance Sheet Data: Pre-filled Beam Therapeutics historical data and forecasts, including revenue, EBITDA, EBIT, and capital expenditures.
- WACC Calculation: A dedicated sheet for Weighted Average Cost of Capital (WACC), including parameters like Beta, risk-free rate, and share price.
- DCF Valuation (Unlevered and Levered): Editable Discounted Cash Flow models showing intrinsic value with detailed calculations.
- Financial Statements: Pre-loaded financial statements (annual and quarterly) to support analysis.
- Key Ratios: Includes profitability, leverage, and efficiency ratios for Beam Therapeutics Inc. (BEAM).
- Dashboard and Charts: Visual summary of valuation outputs and assumptions to analyze results easily.
Disclaimer
All information, articles, and product details provided on this website are for general informational and educational purposes only. We do not claim any ownership over, nor do we intend to infringe upon, any trademarks, copyrights, logos, brand names, or other intellectual property mentioned or depicted on this site. Such intellectual property remains the property of its respective owners, and any references here are made solely for identification or informational purposes, without implying any affiliation, endorsement, or partnership.
We make no representations or warranties, express or implied, regarding the accuracy, completeness, or suitability of any content or products presented. Nothing on this website should be construed as legal, tax, investment, financial, medical, or other professional advice. In addition, no part of this site—including articles or product references—constitutes a solicitation, recommendation, endorsement, advertisement, or offer to buy or sell any securities, franchises, or other financial instruments, particularly in jurisdictions where such activity would be unlawful.
All content is of a general nature and may not address the specific circumstances of any individual or entity. It is not a substitute for professional advice or services. Any actions you take based on the information provided here are strictly at your own risk. You accept full responsibility for any decisions or outcomes arising from your use of this website and agree to release us from any liability in connection with your use of, or reliance upon, the content or products found herein.