
|
Sra. Bectors Food Specialties Limited (Bectorfood.ns) Valoración de DCF |
Completamente Editable: Adáptelo A Sus Necesidades En Excel O Sheets
Diseño Profesional: Plantillas Confiables Y Estándares De La Industria
Predeterminadas Para Un Uso Rápido Y Eficiente
Compatible con MAC / PC, completamente desbloqueado
No Se Necesita Experiencia; Fáciles De Seguir
Mrs. Bectors Food Specialities Limited (BECTORFOOD.NS) Bundle
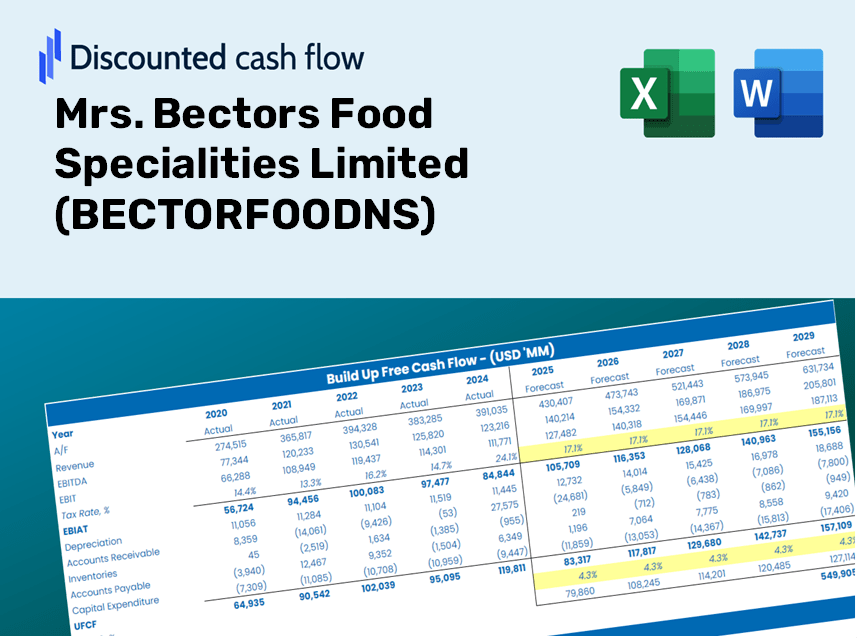
¡Mejore sus opciones de inversión con la calculadora DCF (bectorfoodns)! Explore datos financieros auténticos para la Sra. Bectors Food Specialties Limited, ajuste las proyecciones y gastos de crecimiento, y observe instantáneamente cómo estas modificaciones afectan el valor intrínseco de (Bectorfoodns).
What You Will Receive
- Authentic BECTORFOODNS Data: Comprehensive financials – including revenue and EBIT – derived from both actual and projected statistics.
- Complete Customization: Modify all essential parameters (yellow cells) such as WACC, growth %, and tax rates as needed.
- Real-Time Valuation Updates: Automatic recalculations to assess the effects of adjustments on BECTORFOODNS's fair value.
- Flexible Excel Template: Designed for easy edits, scenario analysis, and in-depth forecasts.
- Efficient and Precise: Avoid the hassle of building models from the ground up while ensuring accuracy and adaptability.
Key Features
- Customizable Forecast Inputs: Adjust essential metrics such as revenue growth, EBITDA percentages, and capital expenditures with ease.
- Instant DCF Valuation: Automatically computes intrinsic value, NPV, and additional financial metrics in real-time.
- High Precision Results: Relies on Mrs. Bectors Food Specialities Limited's [BECTORFOODNS] actual financial data for dependable valuation results.
- Streamlined Scenario Analysis: Effortlessly evaluate various assumptions and analyze their impacts on outcomes.
- Efficient Valuation Solution: Save time by avoiding the construction of intricate valuation models from the ground up.
How It Works
- Download: Get the pre-made Excel file containing Mrs. Bectors Food Specialities Limited’s (BECTORFOODNS) financial information.
- Customize: Modify projections such as revenue growth, EBITDA %, and WACC to fit your analysis.
- Update Automatically: Watch as the intrinsic value and NPV calculations refresh in real-time.
- Test Scenarios: Generate various forecasts and instantly compare the results.
- Make Decisions: Leverage the valuation insights to inform your investment strategies.
Why Choose Our Calculator for Mrs. Bectors Food Specialities Limited (BECTORFOODNS)?
- All-in-One Solution: Combines DCF, WACC, and financial ratio analyses tailored for BECTORFOODNS in a single tool.
- Flexible Inputs: Modify the yellow-highlighted cells to explore different financial scenarios for BECTORFOODNS.
- In-Depth Analysis: Automatically computes the intrinsic value and Net Present Value of BECTORFOODNS.
- Preloaded Information: Historical and projected data provide a reliable foundation for analysis.
- High-Quality Insights: Perfect for financial analysts, investors, and consultants focusing on BECTORFOODNS.
Who Can Benefit from This Product?
- Individual Investors: Gain insights to make informed decisions regarding buying or selling Mrs. Bectors Food Specialities Limited (BECTORFOODNS) shares.
- Financial Analysts: Enhance valuation processes with accessible financial models tailored for Mrs. Bectors Food Specialities Limited (BECTORFOODNS).
- Consultants: Provide accurate and timely valuation insights for clients interested in Mrs. Bectors Food Specialities Limited (BECTORFOODNS).
- Business Owners: Learn how large food companies like Mrs. Bectors Food Specialities Limited (BECTORFOODNS) are valued to inform your own business strategies.
- Finance Students: Explore valuation techniques through practical applications involving real-world data from Mrs. Bectors Food Specialities Limited (BECTORFOODNS).
Contents of the Template
- Pre-Filled DCF Model: Financial data for Mrs. Bectors Food Specialities Limited (BECTORFOODNS) preloaded for instant access.
- WACC Calculator: Comprehensive calculations for the Weighted Average Cost of Capital.
- Financial Ratios: Assess Mrs. Bectors' profitability, leverage, and operational efficiency.
- Editable Inputs: Modify assumptions such as growth rates, profit margins, and capital expenditures to tailor your analysis.
- Financial Statements: Annual and quarterly reports to facilitate in-depth examination.
- Interactive Dashboard: Effortlessly visualize key valuation metrics and outcomes.
Disclaimer
All information, articles, and product details provided on this website are for general informational and educational purposes only. We do not claim any ownership over, nor do we intend to infringe upon, any trademarks, copyrights, logos, brand names, or other intellectual property mentioned or depicted on this site. Such intellectual property remains the property of its respective owners, and any references here are made solely for identification or informational purposes, without implying any affiliation, endorsement, or partnership.
We make no representations or warranties, express or implied, regarding the accuracy, completeness, or suitability of any content or products presented. Nothing on this website should be construed as legal, tax, investment, financial, medical, or other professional advice. In addition, no part of this site—including articles or product references—constitutes a solicitation, recommendation, endorsement, advertisement, or offer to buy or sell any securities, franchises, or other financial instruments, particularly in jurisdictions where such activity would be unlawful.
All content is of a general nature and may not address the specific circumstances of any individual or entity. It is not a substitute for professional advice or services. Any actions you take based on the information provided here are strictly at your own risk. You accept full responsibility for any decisions or outcomes arising from your use of this website and agree to release us from any liability in connection with your use of, or reliance upon, the content or products found herein.