
|
Valoración de DCF de Brookfield BRP Holdings (Canadá (BEPH) |
Completamente Editable: Adáptelo A Sus Necesidades En Excel O Sheets
Diseño Profesional: Plantillas Confiables Y Estándares De La Industria
Predeterminadas Para Un Uso Rápido Y Eficiente
Compatible con MAC / PC, completamente desbloqueado
No Se Necesita Experiencia; Fáciles De Seguir
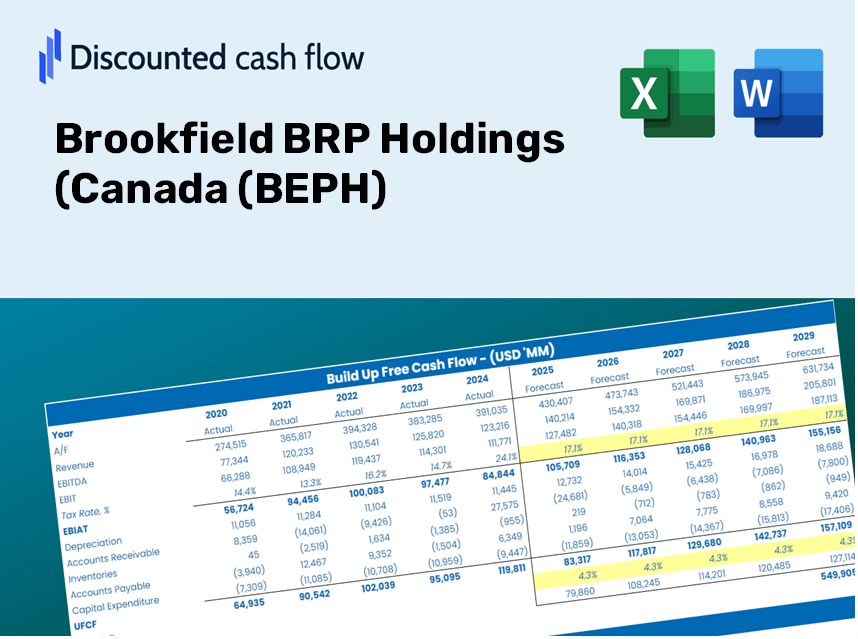
Brookfield BRP Holdings (Canada (BEPH) Bundle
¡Agilice su análisis y mejore la precisión con nuestra calculadora DCF de Brookfield BRP Holdings (BEPH)! Utilizando datos reales de Brookfield y suposiciones personalizables, esta herramienta le permite pronosticar, analizar y valorar Brookfield BRP Holdings como un inversor experimentado.
Discounted Cash Flow (DCF) - (USD MM)
| Year | AY1 2020 |
AY2 2021 |
AY3 2022 |
AY4 2023 |
AY5 2024 |
FY1 2025 |
FY2 2026 |
FY3 2027 |
FY4 2028 |
FY5 2029 |
|---|---|---|---|---|---|---|---|---|---|---|
| Revenue | 3,810.0 | 4,096.0 | 4,711.0 | 5,038.0 | 5,876.0 | 6,553.2 | 7,308.3 | 8,150.5 | 9,089.8 | 10,137.3 |
| Revenue Growth, % | 0 | 7.51 | 15.01 | 6.94 | 16.63 | 11.52 | 11.52 | 11.52 | 11.52 | 11.52 |
| EBITDA | 2,160.0 | 2,444.0 | 2,958.0 | 4,058.0 | 3,798.0 | 4,250.8 | 4,740.7 | 5,287.0 | 5,896.3 | 6,575.8 |
| EBITDA, % | 56.69 | 59.67 | 62.79 | 80.55 | 64.64 | 64.87 | 64.87 | 64.87 | 64.87 | 64.87 |
| Depreciation | 1,367.0 | 1,515.0 | 1,598.0 | 1,863.0 | 2,010.0 | 2,332.6 | 2,601.4 | 2,901.2 | 3,235.5 | 3,608.3 |
| Depreciation, % | 35.88 | 36.99 | 33.92 | 36.98 | 34.21 | 35.59 | 35.59 | 35.59 | 35.59 | 35.59 |
| EBIT | 793.0 | 929.0 | 1,360.0 | 2,195.0 | 1,788.0 | 1,918.2 | 2,139.3 | 2,385.8 | 2,660.8 | 2,967.4 |
| EBIT, % | 20.81 | 22.68 | 28.87 | 43.57 | 30.43 | 29.27 | 29.27 | 29.27 | 29.27 | 29.27 |
| Total Cash | 639.0 | 1,083.5 | 1,261.4 | 1,641.6 | 3,786.7 | 2,189.1 | 2,441.4 | 2,722.8 | 3,036.5 | 3,386.5 |
| Total Cash, percent | .0 | .0 | .0 | .0 | .0 | .0 | .0 | .0 | .0 | .0 |
| Account Receivables | 894.0 | 897.8 | 1,132.5 | 2,508.1 | 2,270.6 | 2,068.8 | 2,307.2 | 2,573.1 | 2,869.6 | 3,200.3 |
| Account Receivables, % | 23.46 | 21.92 | 24.04 | 49.78 | 38.64 | 31.57 | 31.57 | 31.57 | 31.57 | 31.57 |
| Inventories | 26.0 | 31.0 | 42.0 | 110.4 | 153.9 | 93.6 | 104.4 | 116.4 | 129.8 | 144.8 |
| Inventories, % | 0.68241 | 0.75581 | 0.89113 | 2.19 | 2.62 | 1.43 | 1.43 | 1.43 | 1.43 | 1.43 |
| Accounts Payable | 127.0 | 207.7 | 275.9 | 386.0 | 786.5 | 462.8 | 516.1 | 575.6 | 641.9 | 715.9 |
| Accounts Payable, % | 3.33 | 5.07 | 5.86 | 7.66 | 13.39 | 7.06 | 7.06 | 7.06 | 7.06 | 7.06 |
| Capital Expenditure | -470.6 | -1,949.7 | -2,103.2 | -2,860.5 | -3,553.8 | -2,907.7 | -3,242.8 | -3,616.5 | -4,033.2 | -4,498.0 |
| Capital Expenditure, % | -12.35 | -47.6 | -44.65 | -56.78 | -60.48 | -44.37 | -44.37 | -44.37 | -44.37 | -44.37 |
| Tax Rate, % | -9 | -9 | -9 | -9 | -9 | -9 | -9 | -9 | -9 | -9 |
| EBITAT | 536.9 | 2,429.7 | -1,220.0 | -193.2 | 1,948.9 | 1,027.1 | 1,145.4 | 1,277.4 | 1,424.6 | 1,588.8 |
| Depreciation | ||||||||||
| Changes in Account Receivables | ||||||||||
| Changes in Inventories | ||||||||||
| Changes in Accounts Payable | ||||||||||
| Capital Expenditure | ||||||||||
| UFCF | 640.3 | 2,067.0 | -1,902.8 | -2,524.7 | 999.6 | 390.3 | 308.1 | 343.7 | 383.3 | 427.4 |
| WACC, % | 4.64 | 6.13 | 1.54 | 1.54 | 6.13 | 3.99 | 3.99 | 3.99 | 3.99 | 3.99 |
| PV UFCF | ||||||||||
| SUM PV UFCF | 1,645.0 | |||||||||
| Long Term Growth Rate, % | 2.00 | |||||||||
| Free cash flow (T + 1) | 436 | |||||||||
| Terminal Value | 21,873 | |||||||||
| Present Terminal Value | 17,984 | |||||||||
| Enterprise Value | 19,629 | |||||||||
| Net Debt | 32,108 | |||||||||
| Equity Value | -12,479 | |||||||||
| Diluted Shares Outstanding, MM | 285 | |||||||||
| Equity Value Per Share | -43.76 |
What You Will Receive
- Genuine Brookfield Data: Preloaded financials – encompassing metrics from revenue to EBIT – based on actual and projected figures.
- Complete Customization: Tailor all essential parameters (yellow cells) such as WACC, growth %, and tax rates to fit your analysis.
- Instant Valuation Adjustments: Automatic recalculations to assess the effect of changes on Brookfield's fair value.
- Flexible Excel Template: Designed for quick modifications, scenario simulations, and comprehensive projections.
- Efficient and Precise: Eliminate the need to construct models from the ground up while ensuring accuracy and adaptability.
Key Features
- Real-Time BEPH Data: Instantly populated with Brookfield BRP Holdings' historical financials and future projections.
- Customizable Variables: Modify growth rates, profit margins, discount rates, tax percentages, and capital investments.
- Adaptive Valuation Framework: Automatically recalculates Net Present Value (NPV) and intrinsic value based on user inputs.
- Scenario Analysis: Develop and compare various forecast scenarios to assess different valuation results.
- Intuitive Interface: Designed to be straightforward and accessible for both novice and expert users.
How It Works
- Step 1: Download the prebuilt Excel template with Brookfield BRP Holdings (Canada) (BEPH) data included.
- Step 2: Explore the pre-filled sheets to gain insights into the key metrics.
- Step 3: Update forecasts and assumptions in the editable yellow cells (WACC, growth, margins).
- Step 4: Instantly view the recalculated results, including Brookfield BRP Holdings' intrinsic value.
- Step 5: Make informed investment decisions or generate reports based on the outputs.
Why Choose This Calculator for Brookfield BRP Holdings (BEPH)?
- User-Friendly Interface: Crafted for both novice users and seasoned professionals.
- Customizable Inputs: Effortlessly alter assumptions to fit your analysis needs.
- Real-Time Feedback: Witness immediate adjustments in Brookfield's valuation as you change parameters.
- Preconfigured Data: Comes preloaded with Brookfield's current financial information for swift evaluations.
- Relied Upon by Experts: Favored by investors and analysts for well-informed decision-making.
Who Can Benefit from This Product?
- Professional Investors: Create accurate and comprehensive valuation models for portfolio evaluation.
- Corporate Finance Teams: Examine valuation scenarios to inform strategic decision-making.
- Consultants and Advisors: Deliver precise valuation insights regarding Brookfield BRP Holdings (BEPH) to clients.
- Students and Educators: Utilize real-world data to enhance the learning and teaching of financial modeling techniques.
- Finance Enthusiasts: Gain a deeper understanding of how companies like Brookfield BRP Holdings (BEPH) are valued in the market.
Contents of the Template
- Pre-Filled DCF Model: Brookfield BRP Holdings' financial data preloaded for immediate analysis.
- WACC Calculator: Comprehensive calculations for Weighted Average Cost of Capital.
- Financial Ratios: Assess Brookfield's profitability, leverage, and operational efficiency.
- Editable Inputs: Adjust assumptions such as growth rates, margins, and capital expenditures to suit your scenarios.
- Financial Statements: Annual and quarterly reports provided for in-depth analysis.
- Interactive Dashboard: Effortlessly visualize critical valuation metrics and outcomes.
Disclaimer
All information, articles, and product details provided on this website are for general informational and educational purposes only. We do not claim any ownership over, nor do we intend to infringe upon, any trademarks, copyrights, logos, brand names, or other intellectual property mentioned or depicted on this site. Such intellectual property remains the property of its respective owners, and any references here are made solely for identification or informational purposes, without implying any affiliation, endorsement, or partnership.
We make no representations or warranties, express or implied, regarding the accuracy, completeness, or suitability of any content or products presented. Nothing on this website should be construed as legal, tax, investment, financial, medical, or other professional advice. In addition, no part of this site—including articles or product references—constitutes a solicitation, recommendation, endorsement, advertisement, or offer to buy or sell any securities, franchises, or other financial instruments, particularly in jurisdictions where such activity would be unlawful.
All content is of a general nature and may not address the specific circumstances of any individual or entity. It is not a substitute for professional advice or services. Any actions you take based on the information provided here are strictly at your own risk. You accept full responsibility for any decisions or outcomes arising from your use of this website and agree to release us from any liability in connection with your use of, or reliance upon, the content or products found herein.