
|
Valoración de DCF BioCon Limited (BioCon.NS) |
Completamente Editable: Adáptelo A Sus Necesidades En Excel O Sheets
Diseño Profesional: Plantillas Confiables Y Estándares De La Industria
Predeterminadas Para Un Uso Rápido Y Eficiente
Compatible con MAC / PC, completamente desbloqueado
No Se Necesita Experiencia; Fáciles De Seguir
Biocon Limited (BIOCON.NS) Bundle
¡Mejore sus estrategias de inversión con la calculadora DCF (bioconns)! Explore las finanzas limitadas genuinas de Biocon, ajuste las predicciones y gastos de crecimiento, y observe instantáneamente cómo estas alteraciones afectan el valor intrínseco de (Bioconns).
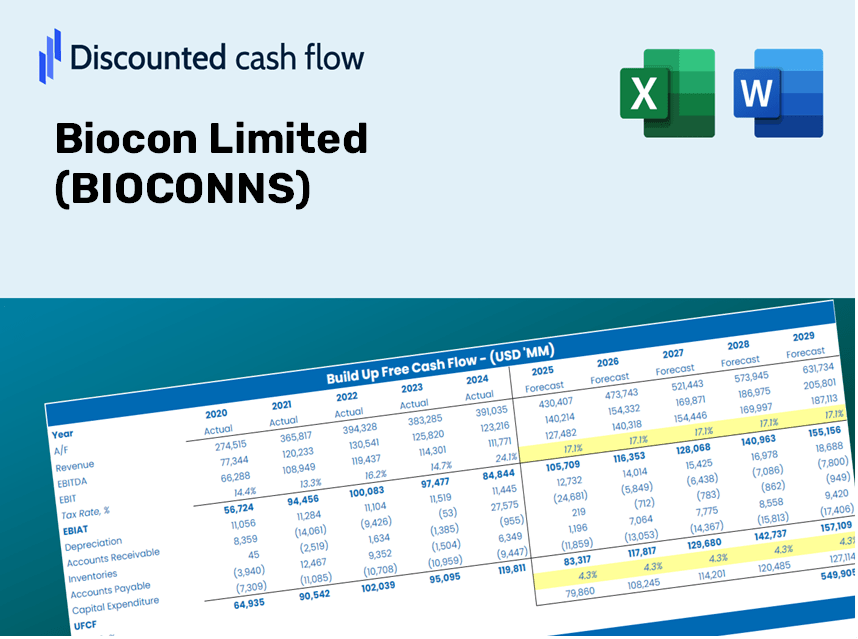
Discounted Cash Flow (DCF) - (USD MM)
| Year | AY1 2021 |
AY2 2022 |
AY3 2023 |
AY4 2024 |
AY5 2025 |
FY1 2026 |
FY2 2027 |
FY3 2028 |
FY4 2029 |
FY5 2030 |
|---|---|---|---|---|---|---|---|---|---|---|
| Revenue | 71,431.0 | 81,840.0 | 111,742.0 | 147,557.0 | 152,617.0 | 185,654.7 | 225,844.3 | 274,733.9 | 334,206.9 | 406,554.3 |
| Revenue Growth, % | 0 | 14.57 | 36.54 | 32.05 | 3.43 | 21.65 | 21.65 | 21.65 | 21.65 | 21.65 |
| EBITDA | 16,522.0 | 19,564.0 | 26,567.0 | 32,711.0 | 31,239.0 | 42,124.2 | 51,243.1 | 62,335.9 | 75,830.1 | 92,245.4 |
| EBITDA, % | 23.13 | 23.91 | 23.78 | 22.17 | 20.47 | 22.69 | 22.69 | 22.69 | 22.69 | 22.69 |
| Depreciation | 6,983.0 | 7,981.0 | 10,924.0 | 14,877.0 | 15,808.0 | 18,470.4 | 22,468.8 | 27,332.8 | 33,249.6 | 40,447.3 |
| Depreciation, % | 9.78 | 9.75 | 9.78 | 10.08 | 10.36 | 9.95 | 9.95 | 9.95 | 9.95 | 9.95 |
| EBIT | 9,539.0 | 11,583.0 | 15,643.0 | 17,834.0 | 15,431.0 | 23,653.8 | 28,774.2 | 35,003.1 | 42,580.4 | 51,798.0 |
| EBIT, % | 13.35 | 14.15 | 14 | 12.09 | 10.11 | 12.74 | 12.74 | 12.74 | 12.74 | 12.74 |
| Total Cash | 32,238.0 | 29,649.0 | 37,260.0 | 25,740.0 | 49,242.0 | 61,048.3 | 74,263.7 | 90,340.0 | 109,896.3 | 133,686.1 |
| Total Cash, percent | .0 | .0 | .0 | .0 | .0 | .0 | .0 | .0 | .0 | .0 |
| Account Receivables | 20,168.0 | 25,759.0 | 37,053.0 | 62,695.0 | 55,843.0 | 63,845.7 | 77,666.7 | 94,479.6 | 114,932.1 | 139,812.0 |
| Account Receivables, % | 28.23 | 31.47 | 33.16 | 42.49 | 36.59 | 34.39 | 34.39 | 34.39 | 34.39 | 34.39 |
| Inventories | 18,666.0 | 22,982.0 | 42,437.0 | 49,439.0 | 49,311.0 | 58,669.2 | 71,369.6 | 86,819.3 | 105,613.5 | 128,476.1 |
| Inventories, % | 26.13 | 28.08 | 37.98 | 33.51 | 32.31 | 31.6 | 31.6 | 31.6 | 31.6 | 31.6 |
| Accounts Payable | 15,139.0 | 16,085.0 | 38,420.0 | 62,720.0 | 65,487.0 | 59,649.3 | 72,561.9 | 88,269.7 | 107,377.9 | 130,622.5 |
| Accounts Payable, % | 21.19 | 19.65 | 34.38 | 42.51 | 42.91 | 32.13 | 32.13 | 32.13 | 32.13 | 32.13 |
| Capital Expenditure | -17,463.0 | -19,248.0 | -17,263.0 | -19,316.0 | -23,433.0 | -34,108.5 | -41,492.2 | -50,474.2 | -61,400.5 | -74,692.2 |
| Capital Expenditure, % | -24.45 | -23.52 | -15.45 | -13.09 | -15.35 | -18.37 | -18.37 | -18.37 | -18.37 | -18.37 |
| Tax Rate, % | 46.29 | 46.29 | 46.29 | 46.29 | 46.29 | 46.29 | 46.29 | 46.29 | 46.29 | 46.29 |
| EBITAT | 6,615.7 | 7,639.5 | 8,068.2 | 11,956.0 | 8,288.0 | 14,553.6 | 17,704.1 | 21,536.5 | 26,198.7 | 31,870.0 |
| Depreciation | ||||||||||
| Changes in Account Receivables | ||||||||||
| Changes in Inventories | ||||||||||
| Changes in Accounts Payable | ||||||||||
| Capital Expenditure | ||||||||||
| UFCF | -27,559.3 | -12,588.5 | -6,684.8 | -827.0 | 10,410.0 | -24,283.0 | -14,928.1 | -18,159.6 | -22,090.7 | -26,872.8 |
| WACC, % | 4.35 | 4.3 | 4.09 | 4.31 | 4.12 | 4.23 | 4.23 | 4.23 | 4.23 | 4.23 |
| PV UFCF | ||||||||||
| SUM PV UFCF | -93,629.9 | |||||||||
| Long Term Growth Rate, % | 4.00 | |||||||||
| Free cash flow (T + 1) | -27,948 | |||||||||
| Terminal Value | -12,000,577 | |||||||||
| Present Terminal Value | -9,753,900 | |||||||||
| Enterprise Value | -9,847,530 | |||||||||
| Net Debt | 151,349 | |||||||||
| Equity Value | -9,998,879 | |||||||||
| Diluted Shares Outstanding, MM | 1,198 | |||||||||
| Equity Value Per Share | -8,348.02 |
What You'll Receive
- Adjustable Forecast Inputs: Seamlessly modify assumptions (growth %, margins, WACC) to generate various scenarios.
- Real-Time Data: Biocon Limited’s financial information pre-loaded to kickstart your analysis.
- Automated DCF Outputs: The template calculates Net Present Value (NPV) and intrinsic value for you.
- Customizable and Professional: A refined Excel model that tailors to your valuation requirements.
- Designed for Analysts and Investors: Perfect for evaluating projections, validating strategies, and optimizing efficiency.
Key Features
- Comprehensive DCF Calculator: Offers in-depth unlevered and levered DCF valuation frameworks.
- WACC Calculator: Ready-to-use Weighted Average Cost of Capital worksheet with adjustable parameters.
- Customizable Forecast Assumptions: Update growth projections, capital investments, and discount rates as needed.
- Integrated Financial Ratios: Assess profitability, leverage, and efficiency ratios for Biocon Limited (BIOCONNS).
- User-Friendly Dashboard and Charts: Visual representations of essential valuation metrics facilitate straightforward analysis.
How It Works
- Step 1: Download the ready-to-use Excel template featuring data for Biocon Limited (BIOCONNS).
- Step 2: Navigate through the pre-filled sheets to familiarize yourself with the essential metrics.
- Step 3: Modify the forecasts and assumptions in the editable yellow cells (WACC, growth rates, margins).
- Step 4: Instantly see the updated results, including the intrinsic value of Biocon Limited (BIOCONNS).
- Step 5: Utilize the outputs to make well-informed investment choices or generate detailed reports.
Why Select the Biocon Calculator?
- Time Efficient: Skip the hassle of building a DCF model from the ground up – it’s immediately available.
- Enhanced Precision: Dependable financial insights and calculations minimize valuation errors.
- Completely Customizable: Adjust the model to align with your specific assumptions and forecasts.
- User-Friendly: Intuitive charts and outputs simplify the analysis of results.
- Recommended by Professionals: Crafted for experts who prioritize accuracy and convenience.
Who Should Consider Using This Product?
- Investors: Evaluate Biocon Limited's (BIOCONNS) valuation before making stock trading decisions.
- CFOs and Financial Analysts: Enhance valuation workflows and test financial forecasts for Biocon Limited.
- Startup Founders: Discover how large public companies like Biocon Limited are valued in the market.
- Consultants: Provide clients with detailed and professional valuation reports for Biocon Limited.
- Students and Educators: Utilize real-world data from Biocon Limited to learn and teach valuation methods.
What the Template Includes
- Operating and Balance Sheet Data: Pre-filled historical data and forecasts for Biocon Limited (BIOCONNS), encompassing revenue, EBITDA, EBIT, and capital expenditures.
- WACC Calculation: A dedicated sheet for the Weighted Average Cost of Capital (WACC) featuring key parameters such as Beta, risk-free rate, and share price.
- DCF Valuation (Unlevered and Levered): Editable Discounted Cash Flow models that detail intrinsic value calculations.
- Financial Statements: Pre-loaded annual and quarterly financial statements to facilitate comprehensive analysis.
- Key Ratios: A collection of profitability, leverage, and efficiency ratios specific to Biocon Limited (BIOCONNS).
- Dashboard and Charts: A visual overview of valuation outputs and assumptions to simplify result analysis.
Disclaimer
All information, articles, and product details provided on this website are for general informational and educational purposes only. We do not claim any ownership over, nor do we intend to infringe upon, any trademarks, copyrights, logos, brand names, or other intellectual property mentioned or depicted on this site. Such intellectual property remains the property of its respective owners, and any references here are made solely for identification or informational purposes, without implying any affiliation, endorsement, or partnership.
We make no representations or warranties, express or implied, regarding the accuracy, completeness, or suitability of any content or products presented. Nothing on this website should be construed as legal, tax, investment, financial, medical, or other professional advice. In addition, no part of this site—including articles or product references—constitutes a solicitation, recommendation, endorsement, advertisement, or offer to buy or sell any securities, franchises, or other financial instruments, particularly in jurisdictions where such activity would be unlawful.
All content is of a general nature and may not address the specific circumstances of any individual or entity. It is not a substitute for professional advice or services. Any actions you take based on the information provided here are strictly at your own risk. You accept full responsibility for any decisions or outcomes arising from your use of this website and agree to release us from any liability in connection with your use of, or reliance upon, the content or products found herein.