
|
Valoración DCF de Blackboxstocks Inc. (BLBX) |
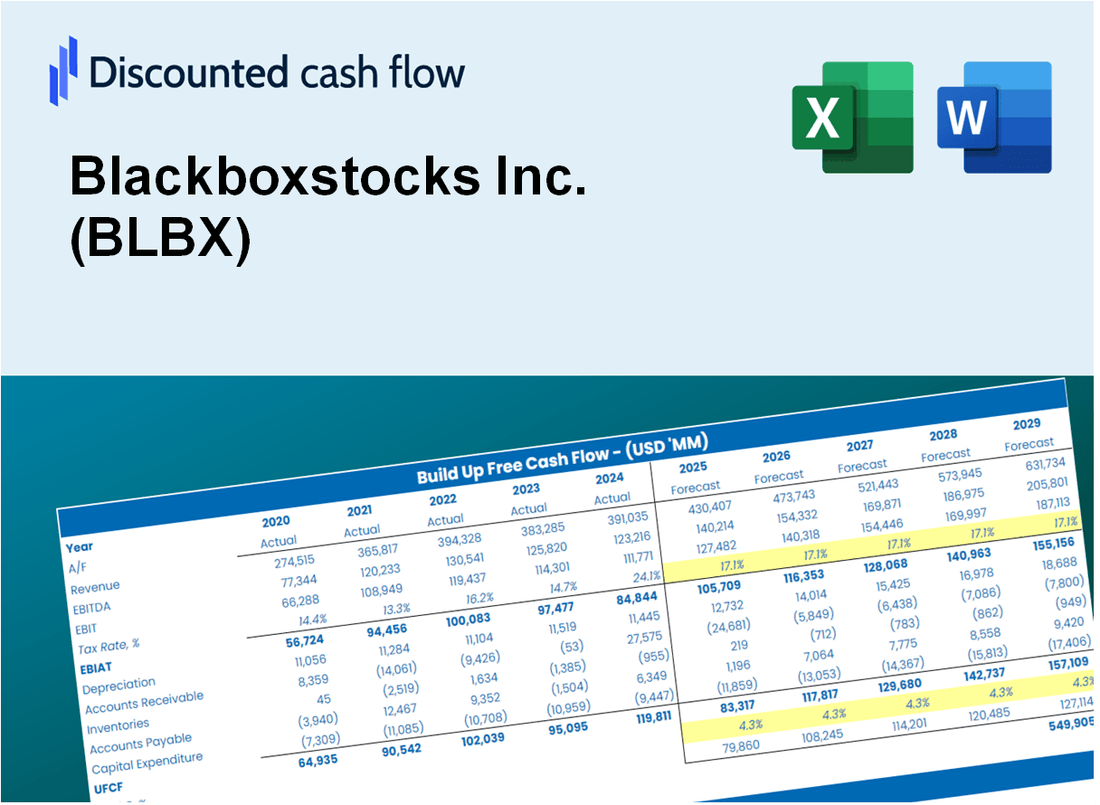
Completamente Editable: Adáptelo A Sus Necesidades En Excel O Sheets
Diseño Profesional: Plantillas Confiables Y Estándares De La Industria
Predeterminadas Para Un Uso Rápido Y Eficiente
Compatible con MAC / PC, completamente desbloqueado
No Se Necesita Experiencia; Fáciles De Seguir
Blackboxstocks Inc. (BLBX) Bundle
¡Simplifique la valoración de Blackboxstocks Inc. (BLBX) con esta calculadora DCF personalizable! Con el Real Blackboxstocks Inc. (BLBX) Financials y las entradas de pronóstico ajustables, puede probar escenarios y descubrir el valor razonable de Blackboxstocks Inc. (BLBX) en minutos.
What You Will Get
- Real BLBX Financial Data: Pre-filled with Blackboxstocks Inc.'s historical and projected data for precise analysis.
- Fully Editable Template: Modify key inputs like revenue growth, WACC, and EBITDA % with ease.
- Automatic Calculations: See Blackboxstocks Inc.'s intrinsic value update instantly based on your changes.
- Professional Valuation Tool: Designed for investors, analysts, and consultants seeking accurate DCF results.
- User-Friendly Design: Simple structure and clear instructions for all experience levels.
Key Features
- Comprehensive Market Data: Gain access to precise, pre-loaded historical performance and future forecasts for Blackboxstocks Inc. (BLBX).
- Flexible Analysis Parameters: Modify highlighted fields such as volatility, trading volumes, and price targets.
- Real-Time Analytics: Instant updates to key metrics, including risk assessments and market trends.
- User-Friendly Interface: Intuitive graphs and summaries that make understanding your investment insights straightforward.
- Designed for All Users: A clear, accessible design tailored for traders, analysts, and financial advisors.
How It Works
- Download: Obtain the pre-configured Excel file containing Blackboxstocks Inc.'s (BLBX) financial data.
- Customize: Modify forecasts such as revenue growth, EBITDA %, and WACC to suit your analysis.
- Update Automatically: The intrinsic value and NPV calculations refresh in real-time as you make changes.
- Test Scenarios: Generate various projections and instantly compare the results.
- Make Decisions: Leverage the valuation outcomes to inform your investment strategy.
Why Choose Blackboxstocks Inc. (BLBX)?
- Save Time: Access advanced analytics without the hassle of building models from the ground up.
- Enhance Accuracy: Utilize precise market data and sophisticated algorithms to minimize valuation errors.
- Fully Customizable: Adapt the platform to meet your specific trading strategies and market insights.
- Easy to Navigate: User-friendly interface and visualizations simplify data interpretation.
- Endorsed by Professionals: A go-to tool for traders who prioritize accuracy and efficiency.
Who Should Use This Product?
- Investors: Evaluate Blackboxstocks Inc.’s (BLBX) market performance before making investment decisions.
- CFOs and Financial Analysts: Enhance financial modeling and valuation assessments for better insights.
- Startup Founders: Understand the valuation strategies of innovative companies like Blackboxstocks Inc.
- Consultants: Provide comprehensive valuation analyses and reports for your clients.
- Students and Educators: Utilize real-time data to teach and learn about valuation methodologies.
What the Template Contains
- Preloaded BLBX Data: Historical and projected financial data, including revenue, EBIT, and capital expenditures.
- DCF and WACC Models: Professional-grade sheets for calculating intrinsic value and Weighted Average Cost of Capital.
- Editable Inputs: Yellow-highlighted cells for adjusting revenue growth, tax rates, and discount rates.
- Financial Statements: Comprehensive annual and quarterly financials for deeper analysis.
- Key Ratios: Profitability, leverage, and efficiency ratios to evaluate performance.
- Dashboard and Charts: Visual summaries of valuation outcomes and assumptions.
Disclaimer
All information, articles, and product details provided on this website are for general informational and educational purposes only. We do not claim any ownership over, nor do we intend to infringe upon, any trademarks, copyrights, logos, brand names, or other intellectual property mentioned or depicted on this site. Such intellectual property remains the property of its respective owners, and any references here are made solely for identification or informational purposes, without implying any affiliation, endorsement, or partnership.
We make no representations or warranties, express or implied, regarding the accuracy, completeness, or suitability of any content or products presented. Nothing on this website should be construed as legal, tax, investment, financial, medical, or other professional advice. In addition, no part of this site—including articles or product references—constitutes a solicitation, recommendation, endorsement, advertisement, or offer to buy or sell any securities, franchises, or other financial instruments, particularly in jurisdictions where such activity would be unlawful.
All content is of a general nature and may not address the specific circumstances of any individual or entity. It is not a substitute for professional advice or services. Any actions you take based on the information provided here are strictly at your own risk. You accept full responsibility for any decisions or outcomes arising from your use of this website and agree to release us from any liability in connection with your use of, or reliance upon, the content or products found herein.