
|
Valoración DCF de BioLife Solutions, Inc. (BLFS) |
Completamente Editable: Adáptelo A Sus Necesidades En Excel O Sheets
Diseño Profesional: Plantillas Confiables Y Estándares De La Industria
Predeterminadas Para Un Uso Rápido Y Eficiente
Compatible con MAC / PC, completamente desbloqueado
No Se Necesita Experiencia; Fáciles De Seguir
BioLife Solutions, Inc. (BLFS) Bundle
¡Agilice su análisis y mejore la precisión con nuestra calculadora DCF [BLFS]! Utilizando datos actualizados de Biolife Solutions, Inc. y suposiciones personalizables, esta herramienta le permite pronosticar, analizar y valorar las soluciones de Biolife como un inversor experto.
What You Will Get
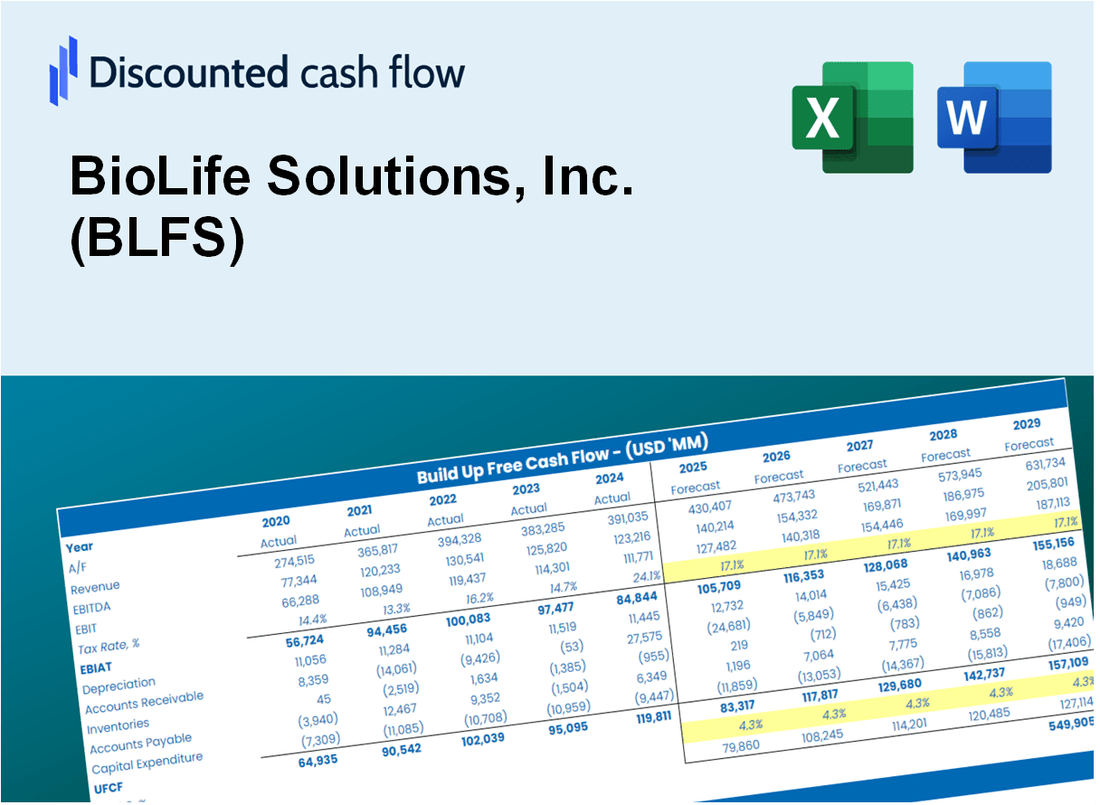
- Real BioLife Data: Preloaded financials – from revenue to EBIT – based on actual and projected figures for BioLife Solutions, Inc. (BLFS).
- Full Customization: Adjust all critical parameters (yellow cells) like WACC, growth %, and tax rates specific to BioLife Solutions, Inc. (BLFS).
- Instant Valuation Updates: Automatic recalculations to analyze the impact of changes on BioLife Solutions, Inc. (BLFS)’s fair value.
- Versatile Excel Template: Tailored for quick edits, scenario testing, and detailed projections for BioLife Solutions, Inc. (BLFS).
- Time-Saving and Accurate: Skip building models from scratch while maintaining precision and flexibility for BioLife Solutions, Inc. (BLFS).
Key Features
- Comprehensive BLFS Data: Pre-loaded with BioLife Solutions' historical performance metrics and future growth estimates.
- Customizable Assumptions: Modify parameters such as revenue growth rates, profit margins, discount rates, tax obligations, and capital investments.
- Interactive Valuation Framework: Real-time updates to Net Present Value (NPV) and intrinsic value based on your customized inputs.
- Scenario Analysis: Develop various forecasting scenarios to evaluate different valuation possibilities.
- Intuitive User Interface: Easy to navigate, structured for both industry professionals and newcomers.
How It Works
- Step 1: Download the prebuilt Excel template containing BioLife Solutions, Inc.'s (BLFS) data.
- Step 2: Navigate through the pre-filled sheets to familiarize yourself with the essential metrics.
- Step 3: Modify forecasts and assumptions in the editable yellow cells (WACC, growth, margins).
- Step 4: Instantly see the recalculated results, including BioLife Solutions, Inc.'s (BLFS) intrinsic value.
- Step 5: Utilize the outputs to make informed investment decisions or create reports.
Why Choose This Calculator for BioLife Solutions, Inc. (BLFS)?
- User-Friendly Interface: Tailored for both novices and seasoned professionals.
- Customizable Inputs: Easily adjust parameters to suit your specific analysis needs.
- Real-Time Valuation: Instantly observe how changes affect BioLife Solutions, Inc.'s (BLFS) valuation.
- Preloaded Data: Comes equipped with BioLife Solutions, Inc.'s (BLFS) actual financial metrics for immediate insights.
- Relied Upon by Experts: Favored by analysts and investors for making data-driven decisions.
Who Should Use This Product?
- Healthcare Investors: Develop comprehensive and accurate valuation models for investment analysis in the biotech sector.
- Biotech Research Teams: Evaluate valuation scenarios to inform strategic decisions and research directions.
- Consultants and Advisors: Deliver precise valuation insights for BioLife Solutions, Inc. (BLFS) to clients.
- Students and Educators: Utilize real-world data to enhance learning and teaching in financial modeling and biotech valuation.
- Industry Enthusiasts: Gain insights into how biotech companies like BioLife Solutions, Inc. (BLFS) are valued in the marketplace.
What the Template Contains
- Pre-Filled DCF Model: BioLife Solutions, Inc.'s (BLFS) financial data preloaded for immediate use.
- WACC Calculator: Detailed calculations for Weighted Average Cost of Capital tailored for BioLife Solutions.
- Financial Ratios: Assess BioLife Solutions' profitability, leverage, and efficiency metrics.
- Editable Inputs: Modify assumptions such as growth rates, margins, and CAPEX to suit your analysis.
- Financial Statements: Comprehensive annual and quarterly reports for in-depth evaluation.
- Interactive Dashboard: Effortlessly visualize key valuation metrics and performance results.
Disclaimer
All information, articles, and product details provided on this website are for general informational and educational purposes only. We do not claim any ownership over, nor do we intend to infringe upon, any trademarks, copyrights, logos, brand names, or other intellectual property mentioned or depicted on this site. Such intellectual property remains the property of its respective owners, and any references here are made solely for identification or informational purposes, without implying any affiliation, endorsement, or partnership.
We make no representations or warranties, express or implied, regarding the accuracy, completeness, or suitability of any content or products presented. Nothing on this website should be construed as legal, tax, investment, financial, medical, or other professional advice. In addition, no part of this site—including articles or product references—constitutes a solicitation, recommendation, endorsement, advertisement, or offer to buy or sell any securities, franchises, or other financial instruments, particularly in jurisdictions where such activity would be unlawful.
All content is of a general nature and may not address the specific circumstances of any individual or entity. It is not a substitute for professional advice or services. Any actions you take based on the information provided here are strictly at your own risk. You accept full responsibility for any decisions or outcomes arising from your use of this website and agree to release us from any liability in connection with your use of, or reliance upon, the content or products found herein.