
|
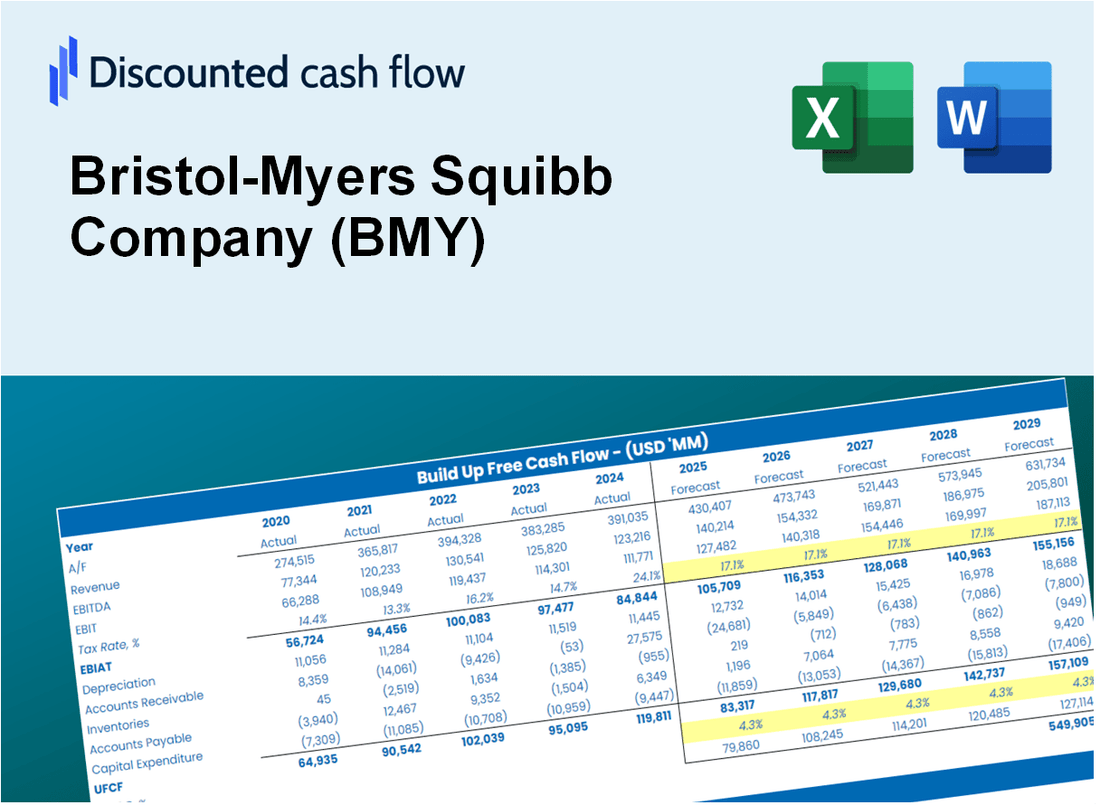
Valoración DCF de Bristol-Myers Squibb Company (BMY) |
Completamente Editable: Adáptelo A Sus Necesidades En Excel O Sheets
Diseño Profesional: Plantillas Confiables Y Estándares De La Industria
Predeterminadas Para Un Uso Rápido Y Eficiente
Compatible con MAC / PC, completamente desbloqueado
No Se Necesita Experiencia; Fáciles De Seguir
Bristol-Myers Squibb Company (BMY) Bundle
¡Obtenga información sobre su análisis de valoración de Bristol-Myers Squibb Company (BMY) utilizando nuestra sofisticada calculadora DCF! Completamente equipado con datos reales (BMY), esta plantilla de Excel le permite ajustar los pronósticos y supuestos para determinar con precisión el valor intrínseco de Bristol-Myers Squibb Company.
Discounted Cash Flow (DCF) - (USD MM)
| Year | AY1 2020 |
AY2 2021 |
AY3 2022 |
AY4 2023 |
AY5 2024 |
FY1 2025 |
FY2 2026 |
FY3 2027 |
FY4 2028 |
FY5 2029 |
|---|---|---|---|---|---|---|---|---|---|---|
| Revenue | 42,518.0 | 46,385.0 | 46,159.0 | 45,006.0 | 48,300.0 | 52,405.1 | 56,859.0 | 61,691.5 | 66,934.7 | 72,623.5 |
| Revenue Growth, % | 0 | 9.09 | -0.48723 | -2.5 | 7.32 | 8.5 | 8.5 | 8.5 | 8.5 | 8.5 |
| EBITDA | 4,929.0 | 20,118.0 | 19,221.0 | 19,366.0 | 3,168.0 | 15,322.6 | 16,624.9 | 18,037.9 | 19,570.9 | 21,234.3 |
| EBITDA, % | 11.59 | 43.37 | 41.64 | 43.03 | 6.56 | 29.24 | 29.24 | 29.24 | 29.24 | 29.24 |
| Depreciation | 10,380.0 | 10,686.0 | 10,276.0 | 9,760.0 | 9,600.0 | 11,662.7 | 12,653.9 | 13,729.4 | 14,896.3 | 16,162.3 |
| Depreciation, % | 24.41 | 23.04 | 22.26 | 21.69 | 19.88 | 22.25 | 22.25 | 22.25 | 22.25 | 22.25 |
| EBIT | -5,451.0 | 9,432.0 | 8,945.0 | 9,606.0 | -6,432.0 | 3,659.9 | 3,971.0 | 4,308.5 | 4,674.6 | 5,071.9 |
| EBIT, % | -12.82 | 20.33 | 19.38 | 21.34 | -13.32 | 6.98 | 6.98 | 6.98 | 6.98 | 6.98 |
| Total Cash | 16,450.0 | 17,221.0 | 9,253.0 | 12,280.0 | 10,859.0 | 15,263.4 | 16,560.7 | 17,968.2 | 19,495.3 | 21,152.2 |
| Total Cash, percent | .0 | .0 | .0 | .0 | .0 | .0 | .0 | .0 | .0 | .0 |
| Account Receivables | 10,554.0 | 12,516.0 | 13,937.0 | 15,264.0 | 14,424.0 | 15,279.0 | 16,577.5 | 17,986.5 | 19,515.2 | 21,173.8 |
| Account Receivables, % | 24.82 | 26.98 | 30.19 | 33.92 | 29.86 | 29.16 | 29.16 | 29.16 | 29.16 | 29.16 |
| Inventories | 2,074.0 | 2,095.0 | 2,339.0 | 2,662.0 | 2,557.0 | 2,690.5 | 2,919.2 | 3,167.3 | 3,436.5 | 3,728.6 |
| Inventories, % | 4.88 | 4.52 | 5.07 | 5.91 | 5.29 | 5.13 | 5.13 | 5.13 | 5.13 | 5.13 |
| Accounts Payable | 2,713.0 | 2,949.0 | 3,040.0 | 3,259.0 | 3,602.0 | 3,566.0 | 3,869.1 | 4,197.9 | 4,554.7 | 4,941.8 |
| Accounts Payable, % | 6.38 | 6.36 | 6.59 | 7.24 | 7.46 | 6.8 | 6.8 | 6.8 | 6.8 | 6.8 |
| Capital Expenditure | -753.0 | -973.0 | -1,118.0 | -1,209.0 | -1,248.0 | -1,211.7 | -1,314.7 | -1,426.4 | -1,547.6 | -1,679.2 |
| Capital Expenditure, % | -1.77 | -2.1 | -2.42 | -2.69 | -2.58 | -2.31 | -2.31 | -2.31 | -2.31 | -2.31 |
| Tax Rate, % | -6.79 | -6.79 | -6.79 | -6.79 | -6.79 | -6.79 | -6.79 | -6.79 | -6.79 | -6.79 |
| EBITAT | -7,136.0 | 8,146.1 | 7,337.6 | 9,133.7 | -6,868.8 | 3,392.6 | 3,680.9 | 3,993.8 | 4,333.2 | 4,701.5 |
| Depreciation | ||||||||||
| Changes in Account Receivables | ||||||||||
| Changes in Inventories | ||||||||||
| Changes in Accounts Payable | ||||||||||
| Capital Expenditure | ||||||||||
| UFCF | -7,424.0 | 16,112.1 | 14,921.6 | 16,253.7 | 2,771.2 | 12,819.1 | 13,796.0 | 14,968.6 | 16,240.7 | 17,621.1 |
| WACC, % | 4.71 | 4.53 | 4.47 | 4.64 | 4.71 | 4.61 | 4.61 | 4.61 | 4.61 | 4.61 |
| PV UFCF | ||||||||||
| SUM PV UFCF | 65,562.9 | |||||||||
| Long Term Growth Rate, % | 2.00 | |||||||||
| Free cash flow (T + 1) | 17,973 | |||||||||
| Terminal Value | 688,470 | |||||||||
| Present Terminal Value | 549,548 | |||||||||
| Enterprise Value | 615,111 | |||||||||
| Net Debt | 40,854 | |||||||||
| Equity Value | 574,257 | |||||||||
| Diluted Shares Outstanding, MM | 2,027 | |||||||||
| Equity Value Per Share | 283.30 |
What You Will Get
- Pre-Filled Financial Model: Bristol-Myers Squibb’s actual data enables precise DCF valuation.
- Full Forecast Control: Adjust revenue growth, margins, WACC, and other key drivers.
- Instant Calculations: Automatic updates ensure you see results as you make changes.
- Investor-Ready Template: A refined Excel file designed for professional-grade valuation.
- Customizable and Reusable: Tailored for flexibility, allowing repeated use for detailed forecasts.
Key Features
- Accurate Financial Data: Gain access to reliable pre-loaded historical figures and future forecasts for Bristol-Myers Squibb Company (BMY).
- Adjustable Forecast Parameters: Modify highlighted cells such as WACC, growth rates, and profit margins to tailor your analysis.
- Real-Time Calculations: Enjoy automatic updates for DCF, Net Present Value (NPV), and cash flow evaluations.
- User-Friendly Dashboard: Utilize clear charts and summaries to effectively visualize your valuation insights.
- Designed for All Skill Levels: A straightforward, intuitive layout catering to investors, CFOs, and consultants alike.
How It Works
- Download: Obtain the pre-prepared Excel file featuring Bristol-Myers Squibb’s financial data.
- Customize: Modify projections, including revenue growth, EBITDA %, and WACC.
- Update Automatically: The intrinsic value and NPV calculations refresh in real-time.
- Test Scenarios: Develop various forecasts and analyze results immediately.
- Make Decisions: Leverage the valuation outcomes to inform your investment approach.
Why Choose This Calculator for Bristol-Myers Squibb (BMY)?
- Designed for Industry Experts: A sophisticated tool tailored for analysts, financial officers, and consultants.
- Accurate Financial Data: Historical and projected financials for Bristol-Myers Squibb preloaded for precision.
- Flexible Scenario Analysis: Effortlessly simulate various forecasts and assumptions.
- Comprehensive Outputs: Automatically computes intrinsic value, NPV, and essential metrics.
- User-Friendly Interface: Step-by-step guidance ensures a smooth experience.
Who Should Use This Product?
- Investors: Evaluate Bristol-Myers Squibb's valuation before making stock trades.
- CFOs and Financial Analysts: Optimize valuation methodologies and assess forecasts.
- Startup Founders: Discover how leading pharmaceutical companies like Bristol-Myers Squibb are appraised.
- Consultants: Provide comprehensive valuation analyses for your clients.
- Students and Educators: Utilize real-time data to practice and teach valuation strategies.
What the Template Contains
- Historical Data: Includes Bristol-Myers Squibb’s past financials and baseline forecasts.
- DCF and Levered DCF Models: Detailed templates to calculate Bristol-Myers Squibb’s intrinsic value.
- WACC Sheet: Pre-built calculations for Weighted Average Cost of Capital.
- Editable Inputs: Modify key drivers like growth rates, EBITDA %, and CAPEX assumptions.
- Quarterly and Annual Statements: A complete breakdown of Bristol-Myers Squibb’s financials.
- Interactive Dashboard: Visualize valuation results and projections dynamically.
Disclaimer
All information, articles, and product details provided on this website are for general informational and educational purposes only. We do not claim any ownership over, nor do we intend to infringe upon, any trademarks, copyrights, logos, brand names, or other intellectual property mentioned or depicted on this site. Such intellectual property remains the property of its respective owners, and any references here are made solely for identification or informational purposes, without implying any affiliation, endorsement, or partnership.
We make no representations or warranties, express or implied, regarding the accuracy, completeness, or suitability of any content or products presented. Nothing on this website should be construed as legal, tax, investment, financial, medical, or other professional advice. In addition, no part of this site—including articles or product references—constitutes a solicitation, recommendation, endorsement, advertisement, or offer to buy or sell any securities, franchises, or other financial instruments, particularly in jurisdictions where such activity would be unlawful.
All content is of a general nature and may not address the specific circumstances of any individual or entity. It is not a substitute for professional advice or services. Any actions you take based on the information provided here are strictly at your own risk. You accept full responsibility for any decisions or outcomes arising from your use of this website and agree to release us from any liability in connection with your use of, or reliance upon, the content or products found herein.