
|
Valoración DCF de BSE Limited (BSE.NS) |
Completamente Editable: Adáptelo A Sus Necesidades En Excel O Sheets
Diseño Profesional: Plantillas Confiables Y Estándares De La Industria
Predeterminadas Para Un Uso Rápido Y Eficiente
Compatible con MAC / PC, completamente desbloqueado
No Se Necesita Experiencia; Fáciles De Seguir
BSE Limited (BSE.NS) Bundle
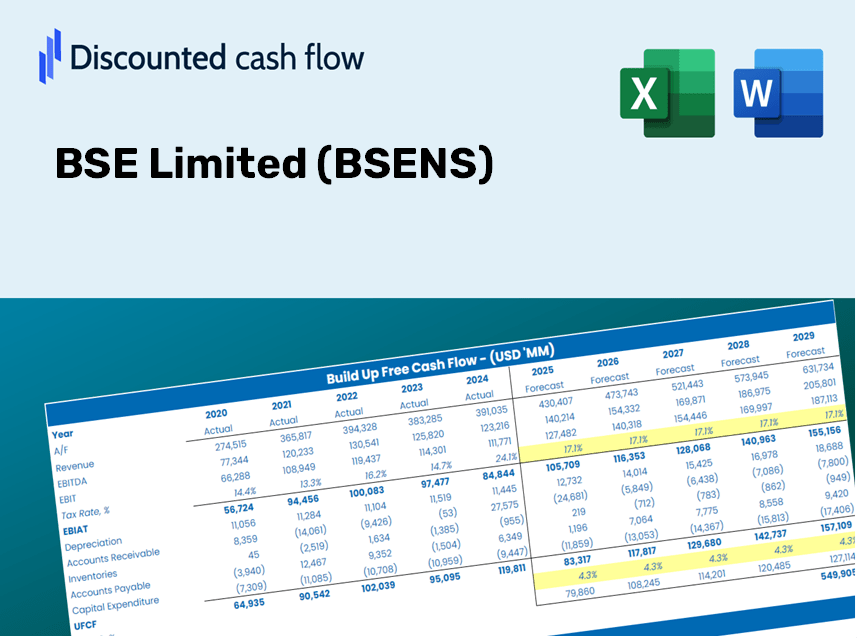
¡Obtenga información sobre su análisis de valoración BSE Limited (BSENS) con nuestra calculadora DCF de vanguardia! Prelabastado con datos reales (BSENS), esta plantilla de Excel le permite ajustar preventos y supuestos para determinar con precisión el valor intrínseco de BSE Limited.
Discounted Cash Flow (DCF) - (USD MM)
| Year | AY1 2021 |
AY2 2022 |
AY3 2023 |
AY4 2024 |
AY5 2025 |
FY1 2026 |
FY2 2027 |
FY3 2028 |
FY4 2029 |
FY5 2030 |
|---|---|---|---|---|---|---|---|---|---|---|
| Revenue | 5,013.7 | 7,431.5 | 8,155.3 | 13,900.3 | 32,363.1 | 50,843.1 | 79,875.6 | 125,486.3 | 197,141.6 | 309,713.6 |
| Revenue Growth, % | 0 | 48.22 | 9.74 | 70.44 | 132.82 | 57.1 | 57.1 | 57.1 | 57.1 | 57.1 |
| EBITDA | 2,207.4 | 3,977.0 | 3,850.8 | 11,060.1 | 18,815.5 | 28,723.0 | 45,124.5 | 70,891.5 | 111,372.1 | 174,967.9 |
| EBITDA, % | 44.03 | 53.52 | 47.22 | 79.57 | 58.14 | 56.49 | 56.49 | 56.49 | 56.49 | 56.49 |
| Depreciation | 578.7 | 482.9 | 603.4 | 954.4 | 1,129.8 | 3,640.0 | 5,718.5 | 8,983.9 | 14,113.9 | 22,173.2 |
| Depreciation, % | 11.54 | 6.5 | 7.4 | 6.87 | 3.49 | 7.16 | 7.16 | 7.16 | 7.16 | 7.16 |
| EBIT | 1,628.7 | 3,494.1 | 3,247.4 | 10,105.7 | 17,685.7 | 25,083.0 | 39,406.0 | 61,907.6 | 97,258.2 | 152,794.7 |
| EBIT, % | 32.48 | 47.02 | 39.82 | 72.7 | 54.65 | 49.33 | 49.33 | 49.33 | 49.33 | 49.33 |
| Total Cash | 29,628.3 | 18,923.9 | 36,213.3 | 55,956.0 | 67,047.0 | 50,843.1 | 79,875.6 | 125,486.3 | 197,141.6 | 309,713.6 |
| Total Cash, percent | .0 | .0 | .0 | .0 | .0 | .0 | .0 | .0 | .0 | .0 |
| Account Receivables | 1,280.8 | 1,289.1 | 1,990.3 | 2,833.0 | 3,096.7 | 9,888.7 | 15,535.3 | 24,406.3 | 38,342.8 | 60,237.4 |
| Account Receivables, % | 25.55 | 17.35 | 24.4 | 20.38 | 9.57 | 19.45 | 19.45 | 19.45 | 19.45 | 19.45 |
| Inventories | .0 | -11,945.3 | .0 | .0 | .0 | -10,168.6 | -15,975.1 | -25,097.3 | -39,428.3 | -61,942.7 |
| Inventories, % | 0 | -160.74 | 0 | 0 | 0 | -20 | -20 | -20 | -20 | -20 |
| Accounts Payable | 981.7 | 728.5 | 804.0 | 1,905.5 | 1,139.6 | 5,742.4 | 9,021.4 | 14,172.8 | 22,265.8 | 34,980.0 |
| Accounts Payable, % | 19.58 | 9.8 | 9.86 | 13.71 | 3.52 | 11.29 | 11.29 | 11.29 | 11.29 | 11.29 |
| Capital Expenditure | -381.9 | -319.6 | -1,434.2 | -1,313.2 | -1,532.3 | -4,442.2 | -6,978.9 | -10,963.9 | -17,224.6 | -27,060.2 |
| Capital Expenditure, % | -7.62 | -4.3 | -17.59 | -9.45 | -4.73 | -8.74 | -8.74 | -8.74 | -8.74 | -8.74 |
| Tax Rate, % | 24.16 | 24.16 | 24.16 | 24.16 | 24.16 | 24.16 | 24.16 | 24.16 | 24.16 | 24.16 |
| EBITAT | 1,546.8 | 2,715.4 | 2,410.7 | 7,901.6 | 13,412.9 | 20,114.2 | 31,599.8 | 49,644.0 | 77,991.7 | 122,526.7 |
| Depreciation | ||||||||||
| Changes in Account Receivables | ||||||||||
| Changes in Inventories | ||||||||||
| Changes in Accounts Payable | ||||||||||
| Capital Expenditure | ||||||||||
| UFCF | 1,444.5 | 14,562.5 | -10,991.1 | 7,801.6 | 11,980.8 | 27,291.3 | 33,778.3 | 53,066.5 | 83,368.5 | 130,973.7 |
| WACC, % | 4.66 | 4.66 | 4.66 | 4.66 | 4.66 | 4.66 | 4.66 | 4.66 | 4.66 | 4.66 |
| PV UFCF | ||||||||||
| SUM PV UFCF | 276,945.3 | |||||||||
| Long Term Growth Rate, % | 2.00 | |||||||||
| Free cash flow (T + 1) | 133,593 | |||||||||
| Terminal Value | 5,014,712 | |||||||||
| Present Terminal Value | 3,992,628 | |||||||||
| Enterprise Value | 4,269,573 | |||||||||
| Net Debt | -51,838 | |||||||||
| Equity Value | 4,321,411 | |||||||||
| Diluted Shares Outstanding, MM | 412 | |||||||||
| Equity Value Per Share | 10,489.35 |
What You Will Receive
- Authentic BSE Limited Data: Comprehensive financials – covering everything from revenue to EBIT – based on real and estimated figures.
- Complete Customization: Modify all essential parameters (yellow cells) such as WACC, growth %, and tax rates.
- Immediate Valuation Adjustments: Automatic updates to evaluate the effects of changes on BSE Limited’s fair value.
- Flexible Excel Template: Designed for quick modifications, scenario analysis, and in-depth forecasts.
- Efficient and Precise: Avoid the hassle of creating models from scratch while ensuring accuracy and adaptability.
Key Features
- Comprehensive DCF Calculator: Features intricate unlevered and levered DCF valuation models tailored for BSE Limited (BSENS).
- WACC Calculator: Ready-to-use Weighted Average Cost of Capital worksheet with adjustable parameters.
- Customizable Forecast Assumptions: Easily update growth rates, capital investments, and discount rates to fit your analysis.
- Integrated Financial Ratios: Evaluate profitability, leverage, and efficiency ratios specifically for BSE Limited (BSENS).
- Interactive Dashboard and Charts: Visual representations encapsulate essential valuation metrics for streamlined analysis.
How It Works
- Step 1: Download the Excel file.
- Step 2: Review BSE Limited's (BSENS) pre-filled financial data and forecasts.
- Step 3: Modify essential inputs such as revenue growth, WACC, and tax rates (highlighted cells).
- Step 4: Observe the DCF model update in real-time as you adjust your assumptions.
- Step 5: Analyze the outputs and utilize the results for your investment decisions.
Why Choose the BSE Limited (BSENS) Calculator?
- Time-Saving: There's no need to build a DCF model from square one – it's all set up for you.
- Enhanced Accuracy: Dependable financial data and formulas minimize valuation errors.
- Completely Customizable: Adjust the model to align with your assumptions and forecasts.
- User-Friendly: Intuitive charts and outputs simplify result analysis.
- Preferred by Professionals: Crafted for experts who prioritize precision and functionality.
Who Can Benefit from BSE Limited (BSENS)?
- Investors: Make informed choices with our advanced valuation tool tailored for professional use.
- Financial Analysts: Streamline your workflow with our ready-to-use DCF model that can be easily customized.
- Consultants: Effortlessly modify the template to suit client presentations and reports.
- Finance Enthusiasts: Enhance your grasp of valuation methodologies through practical real-world examples.
- Educators and Students: Utilize it as a valuable resource for hands-on learning in finance courses.
Contents of the Template
- Historical Data: Comprehensive records of BSE Limited's (BSENS) previous financial performance and baseline projections.
- DCF and Levered DCF Models: In-depth templates for assessing the intrinsic value of BSE Limited (BSENS).
- WACC Sheet: Pre-calculated metrics for the Weighted Average Cost of Capital.
- Editable Inputs: Customize critical parameters such as growth rates, EBITDA percentages, and CAPEX forecasts.
- Quarterly and Annual Statements: A thorough analysis of BSE Limited’s (BSENS) financial statements.
- Interactive Dashboard: Visualize valuation outcomes and forecasts in an engaging manner.
Disclaimer
All information, articles, and product details provided on this website are for general informational and educational purposes only. We do not claim any ownership over, nor do we intend to infringe upon, any trademarks, copyrights, logos, brand names, or other intellectual property mentioned or depicted on this site. Such intellectual property remains the property of its respective owners, and any references here are made solely for identification or informational purposes, without implying any affiliation, endorsement, or partnership.
We make no representations or warranties, express or implied, regarding the accuracy, completeness, or suitability of any content or products presented. Nothing on this website should be construed as legal, tax, investment, financial, medical, or other professional advice. In addition, no part of this site—including articles or product references—constitutes a solicitation, recommendation, endorsement, advertisement, or offer to buy or sell any securities, franchises, or other financial instruments, particularly in jurisdictions where such activity would be unlawful.
All content is of a general nature and may not address the specific circumstances of any individual or entity. It is not a substitute for professional advice or services. Any actions you take based on the information provided here are strictly at your own risk. You accept full responsibility for any decisions or outcomes arising from your use of this website and agree to release us from any liability in connection with your use of, or reliance upon, the content or products found herein.