
|
Valoración DCF de Blue Star Foods Corp. (BSFC) |
Completamente Editable: Adáptelo A Sus Necesidades En Excel O Sheets
Diseño Profesional: Plantillas Confiables Y Estándares De La Industria
Predeterminadas Para Un Uso Rápido Y Eficiente
Compatible con MAC / PC, completamente desbloqueado
No Se Necesita Experiencia; Fáciles De Seguir
Blue Star Foods Corp. (BSFC) Bundle
¡Mejore sus opciones de inversión con la calculadora DCF de Blue Star Foods Corp. (BSFC)! Explore los datos financieros genuinos para los alimentos de las estrellas azules, ajuste las proyecciones y gastos de crecimiento, y observe instantáneamente cómo estas modificaciones afectan el valor intrínseco de (BSFC).
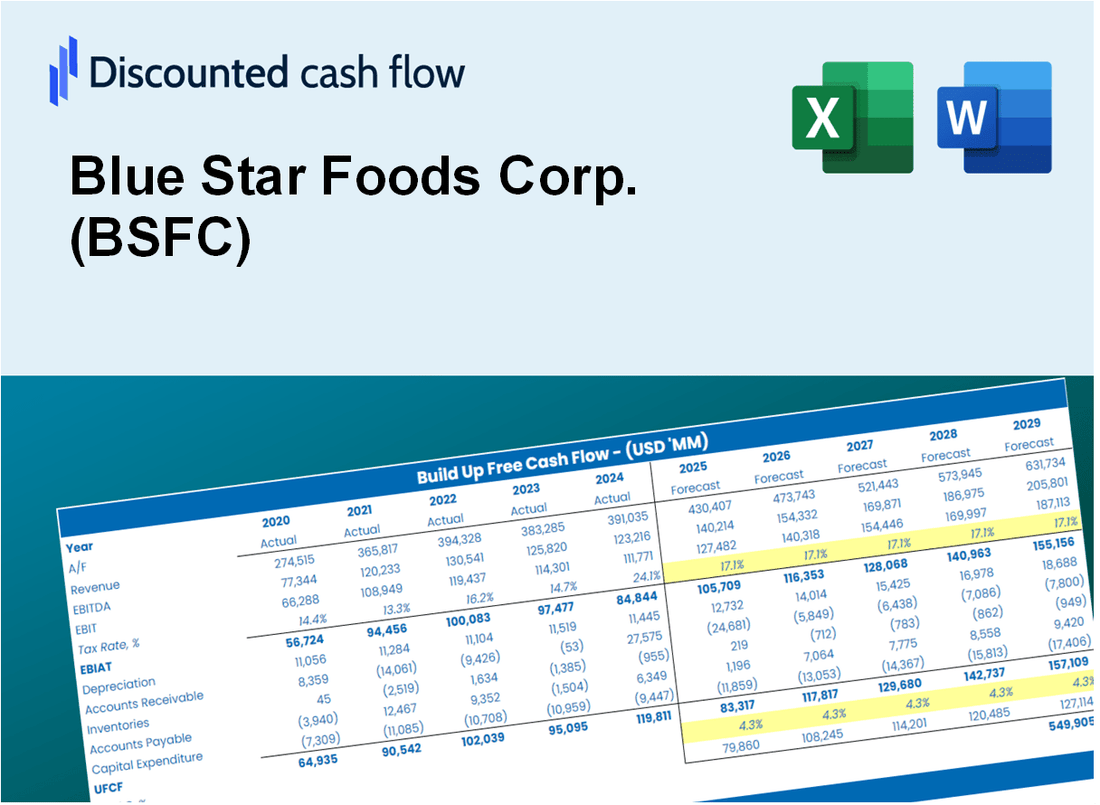
Discounted Cash Flow (DCF) - (USD MM)
| Year | AY1 2020 |
AY2 2021 |
AY3 2022 |
AY4 2023 |
AY5 2024 |
FY1 2025 |
FY2 2026 |
FY3 2027 |
FY4 2028 |
FY5 2029 |
|---|---|---|---|---|---|---|---|---|---|---|
| Revenue | 14.1 | 10.0 | 12.8 | 6.1 | 3.6 | 2.7 | 2.1 | 1.6 | 1.2 | .9 |
| Revenue Growth, % | 0 | -29.32 | 28.01 | -52.03 | -41.32 | -23.66 | -23.66 | -23.66 | -23.66 | -23.66 |
| EBITDA | -3.1 | -1.9 | -10.9 | -2.7 | -10.4 | -1.5 | -1.1 | -.9 | -.7 | -.5 |
| EBITDA, % | -22.13 | -19.14 | -85.17 | -44.01 | -289.71 | -54.09 | -54.09 | -54.09 | -54.09 | -54.09 |
| Depreciation | .4 | .4 | .6 | .0 | .0 | .1 | .0 | .0 | .0 | .0 |
| Depreciation, % | 2.63 | 3.77 | 5.04 | 0.07381792 | 0.16322 | 2.34 | 2.34 | 2.34 | 2.34 | 2.34 |
| EBIT | -3.5 | -2.3 | -11.5 | -2.7 | -10.4 | -1.5 | -1.2 | -.9 | -.7 | -.5 |
| EBIT, % | -24.76 | -22.91 | -90.21 | -44.08 | -289.88 | -56.39 | -56.39 | -56.39 | -56.39 | -56.39 |
| Total Cash | .1 | 1.2 | .0 | .0 | .3 | .1 | .1 | .1 | .1 | .0 |
| Total Cash, percent | .0 | .0 | .0 | .0 | .0 | .0 | .0 | .0 | .0 | .0 |
| Account Receivables | 1.1 | 1.2 | .8 | .5 | .3 | .2 | .2 | .1 | .1 | .1 |
| Account Receivables, % | 7.67 | 12.34 | 6.37 | 8.72 | 9.73 | 8.97 | 8.97 | 8.97 | 8.97 | 8.97 |
| Inventories | 1.8 | 2.1 | 4.8 | 2.7 | .4 | .7 | .5 | .4 | .3 | .2 |
| Inventories, % | 12.99 | 21.25 | 37.66 | 44.15 | 12.46 | 25.7 | 25.7 | 25.7 | 25.7 | 25.7 |
| Accounts Payable | 1.6 | 1.8 | 2.4 | .7 | .0 | .3 | .2 | .2 | .1 | .1 |
| Accounts Payable, % | 11.39 | 17.99 | 18.81 | 10.8 | 0 | 11.8 | 11.8 | 11.8 | 11.8 | 11.8 |
| Capital Expenditure | -.1 | .0 | -.3 | -.2 | -.1 | .0 | .0 | .0 | .0 | .0 |
| Capital Expenditure, % | -0.39358 | 0 | -2.32 | -2.61 | -2.83 | -1.63 | -1.63 | -1.63 | -1.63 | -1.63 |
| Tax Rate, % | 0 | 0 | 0 | 0 | 0 | 0 | 0 | 0 | 0 | 0 |
| EBITAT | -4.9 | -3.0 | -16.7 | -2.7 | -10.4 | -1.5 | -1.2 | -.9 | -.7 | -.5 |
| Depreciation | ||||||||||
| Changes in Account Receivables | ||||||||||
| Changes in Inventories | ||||||||||
| Changes in Accounts Payable | ||||||||||
| Capital Expenditure | ||||||||||
| UFCF | -5.9 | -2.9 | -18.0 | -2.2 | -8.7 | -1.4 | -1.0 | -.8 | -.6 | -.5 |
| WACC, % | 231.79 | 231.79 | 231.79 | 231.79 | 231.79 | 231.79 | 231.79 | 231.79 | 231.79 | 231.79 |
| PV UFCF | ||||||||||
| SUM PV UFCF | -.5 | |||||||||
| Long Term Growth Rate, % | 2.00 | |||||||||
| Free cash flow (T + 1) | 0 | |||||||||
| Terminal Value | 0 | |||||||||
| Present Terminal Value | 0 | |||||||||
| Enterprise Value | -1 | |||||||||
| Net Debt | 1 | |||||||||
| Equity Value | -1 | |||||||||
| Diluted Shares Outstanding, MM | 3 | |||||||||
| Equity Value Per Share | -0.36 |
What You Will Get
- Real Blue Star Data: Preloaded financials – from revenue to EBIT – based on actual and projected figures.
- Full Customization: Adjust all critical parameters (yellow cells) like WACC, growth %, and tax rates.
- Instant Valuation Updates: Automatic recalculations to analyze the impact of changes on Blue Star Foods Corp.’s (BSFC) fair value.
- Versatile Excel Template: Tailored for quick edits, scenario testing, and detailed projections.
- Time-Saving and Accurate: Skip building models from scratch while maintaining precision and flexibility.
Key Features
- Comprehensive DCF Calculator: Features detailed unlevered and levered DCF valuation models tailored for Blue Star Foods Corp. (BSFC).
- WACC Calculator: Ready-to-use Weighted Average Cost of Capital sheet with adjustable inputs specific to BSFC.
- Customizable Forecast Assumptions: Adjust growth rates, capital expenditures, and discount rates to fit BSFC's financial outlook.
- Integrated Financial Ratios: Evaluate profitability, leverage, and efficiency ratios for Blue Star Foods Corp. (BSFC).
- Interactive Dashboard and Charts: Visual representations summarize essential valuation metrics for straightforward analysis of BSFC.
How It Works
- Step 1: Download the prebuilt Excel template featuring Blue Star Foods Corp. (BSFC) data.
- Step 2: Review the pre-filled sheets to familiarize yourself with the key metrics.
- Step 3: Modify forecasts and assumptions in the editable yellow cells (WACC, growth, margins).
- Step 4: Instantly see the recalculated results, including Blue Star Foods Corp.'s (BSFC) intrinsic value.
- Step 5: Make informed investment choices or create reports based on the outputs.
Why Choose Blue Star Foods Corp. (BSFC) Calculator?
- Save Time: Skip the hassle of building a financial model from the ground up – it’s pre-built for your convenience.
- Enhance Accuracy: Dependable financial metrics and calculations minimize valuation errors.
- Fully Customizable: Adjust the model to align with your specific assumptions and forecasts.
- Simple to Understand: Intuitive charts and outputs facilitate straightforward analysis of results.
- Endorsed by Professionals: Crafted for experts who prioritize accuracy and ease of use.
Who Should Use This Product?
- Finance Students: Understand seafood market dynamics and apply valuation techniques using real data from Blue Star Foods Corp. (BSFC).
- Academics: Integrate industry-specific models into your coursework or research focused on sustainable seafood.
- Investors: Evaluate your investment strategies and analyze valuation outcomes for Blue Star Foods Corp. (BSFC).
- Analysts: Enhance your analysis process with a tailored, user-friendly DCF model specific to the seafood industry.
- Small Business Owners: Discover how larger seafood companies like Blue Star Foods Corp. (BSFC) are valued and analyzed in the market.
What the Template Contains
- Historical Data: Includes Blue Star Foods Corp. (BSFC)’s past financials and baseline forecasts.
- DCF and Levered DCF Models: Detailed templates to calculate Blue Star Foods Corp. (BSFC)’s intrinsic value.
- WACC Sheet: Pre-built calculations for Weighted Average Cost of Capital.
- Editable Inputs: Modify key drivers like growth rates, EBITDA %, and CAPEX assumptions.
- Quarterly and Annual Statements: A complete breakdown of Blue Star Foods Corp. (BSFC)’s financials.
- Interactive Dashboard: Visualize valuation results and projections dynamically.
Disclaimer
All information, articles, and product details provided on this website are for general informational and educational purposes only. We do not claim any ownership over, nor do we intend to infringe upon, any trademarks, copyrights, logos, brand names, or other intellectual property mentioned or depicted on this site. Such intellectual property remains the property of its respective owners, and any references here are made solely for identification or informational purposes, without implying any affiliation, endorsement, or partnership.
We make no representations or warranties, express or implied, regarding the accuracy, completeness, or suitability of any content or products presented. Nothing on this website should be construed as legal, tax, investment, financial, medical, or other professional advice. In addition, no part of this site—including articles or product references—constitutes a solicitation, recommendation, endorsement, advertisement, or offer to buy or sell any securities, franchises, or other financial instruments, particularly in jurisdictions where such activity would be unlawful.
All content is of a general nature and may not address the specific circumstances of any individual or entity. It is not a substitute for professional advice or services. Any actions you take based on the information provided here are strictly at your own risk. You accept full responsibility for any decisions or outcomes arising from your use of this website and agree to release us from any liability in connection with your use of, or reliance upon, the content or products found herein.