
|
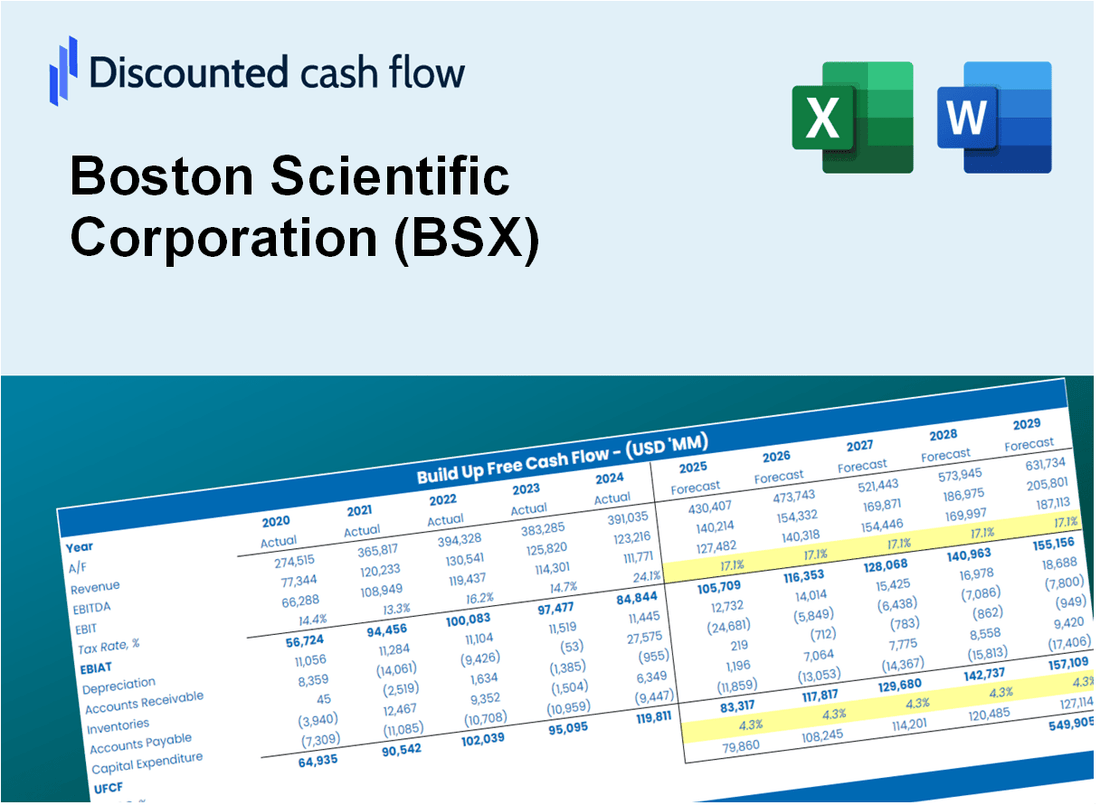
Valoración DCF de Boston Scientific Corporation (BSX) |
Completamente Editable: Adáptelo A Sus Necesidades En Excel O Sheets
Diseño Profesional: Plantillas Confiables Y Estándares De La Industria
Predeterminadas Para Un Uso Rápido Y Eficiente
Compatible con MAC / PC, completamente desbloqueado
No Se Necesita Experiencia; Fáciles De Seguir
Boston Scientific Corporation (BSX) Bundle
¡Evalúe la perspectiva financiera de Boston Scientific Corporation (BSX) con la experiencia! Esta calculadora DCF (BSX) viene equipada con datos financieros previamente llenos y ofrece una flexibilidad completa para modificar el crecimiento de los ingresos, WACC, los márgenes y otros supuestos esenciales para alinearse con sus proyecciones.
Discounted Cash Flow (DCF) - (USD MM)
| Year | AY1 2020 |
AY2 2021 |
AY3 2022 |
AY4 2023 |
AY5 2024 |
FY1 2025 |
FY2 2026 |
FY3 2027 |
FY4 2028 |
FY5 2029 |
|---|---|---|---|---|---|---|---|---|---|---|
| Revenue | 9,913.0 | 11,888.0 | 12,682.0 | 14,240.0 | 16,747.0 | 19,112.2 | 21,811.5 | 24,891.9 | 28,407.5 | 32,419.5 |
| Revenue Growth, % | 0 | 19.92 | 6.68 | 12.29 | 17.61 | 14.12 | 14.12 | 14.12 | 14.12 | 14.12 |
| EBITDA | 1,511.0 | 2,518.0 | 2,741.0 | 3,453.0 | 3,938.0 | 4,044.2 | 4,615.3 | 5,267.1 | 6,011.0 | 6,860.0 |
| EBITDA, % | 15.24 | 21.18 | 21.61 | 24.25 | 23.51 | 21.16 | 21.16 | 21.16 | 21.16 | 21.16 |
| Depreciation | 1,122.0 | 1,093.0 | 1,136.0 | 1,196.0 | 1,269.0 | 1,737.2 | 1,982.5 | 2,262.5 | 2,582.0 | 2,946.7 |
| Depreciation, % | 11.32 | 9.19 | 8.96 | 8.4 | 7.58 | 9.09 | 9.09 | 9.09 | 9.09 | 9.09 |
| EBIT | 389.0 | 1,425.0 | 1,605.0 | 2,257.0 | 2,669.0 | 2,307.0 | 2,632.8 | 3,004.6 | 3,429.0 | 3,913.3 |
| EBIT, % | 3.92 | 11.99 | 12.66 | 15.85 | 15.94 | 12.07 | 12.07 | 12.07 | 12.07 | 12.07 |
| Total Cash | 1,734.0 | 1,925.0 | 928.0 | 865.0 | 414.0 | 1,894.0 | 2,161.5 | 2,466.7 | 2,815.1 | 3,212.7 |
| Total Cash, percent | .0 | .0 | .0 | .0 | .0 | .0 | .0 | .0 | .0 | .0 |
| Account Receivables | 1,531.0 | 1,778.0 | 1,970.0 | 2,228.0 | 2,558.0 | 2,937.7 | 3,352.6 | 3,826.1 | 4,366.5 | 4,983.2 |
| Account Receivables, % | 15.44 | 14.96 | 15.53 | 15.65 | 15.27 | 15.37 | 15.37 | 15.37 | 15.37 | 15.37 |
| Inventories | 1,351.0 | 1,610.0 | 1,867.0 | 2,484.0 | 2,810.0 | 2,909.5 | 3,320.4 | 3,789.4 | 4,324.5 | 4,935.3 |
| Inventories, % | 13.63 | 13.54 | 14.72 | 17.44 | 16.78 | 15.22 | 15.22 | 15.22 | 15.22 | 15.22 |
| Accounts Payable | 513.0 | 794.0 | 862.0 | 942.0 | 960.0 | 1,184.9 | 1,352.2 | 1,543.2 | 1,761.2 | 2,009.9 |
| Accounts Payable, % | 5.18 | 6.68 | 6.8 | 6.62 | 5.73 | 6.2 | 6.2 | 6.2 | 6.2 | 6.2 |
| Capital Expenditure | -376.0 | -554.0 | -612.0 | -800.0 | -790.0 | -902.6 | -1,030.1 | -1,175.6 | -1,341.6 | -1,531.1 |
| Capital Expenditure, % | -3.79 | -4.66 | -4.83 | -5.62 | -4.72 | -4.72 | -4.72 | -4.72 | -4.72 | -4.72 |
| Tax Rate, % | 18.76 | 18.76 | 18.76 | 18.76 | 18.76 | 18.76 | 18.76 | 18.76 | 18.76 | 18.76 |
| EBITAT | 403.8 | 1,377.3 | 981.8 | 1,811.3 | 2,168.4 | 1,934.8 | 2,208.0 | 2,519.8 | 2,875.7 | 3,281.9 |
| Depreciation | ||||||||||
| Changes in Account Receivables | ||||||||||
| Changes in Inventories | ||||||||||
| Changes in Accounts Payable | ||||||||||
| Capital Expenditure | ||||||||||
| UFCF | -1,219.2 | 1,691.3 | 1,124.8 | 1,412.3 | 2,009.4 | 2,515.0 | 2,501.9 | 2,855.3 | 3,258.5 | 3,718.7 |
| WACC, % | 6.28 | 6.28 | 6.19 | 6.23 | 6.24 | 6.24 | 6.24 | 6.24 | 6.24 | 6.24 |
| PV UFCF | ||||||||||
| SUM PV UFCF | 12,269.1 | |||||||||
| Long Term Growth Rate, % | 4.00 | |||||||||
| Free cash flow (T + 1) | 3,867 | |||||||||
| Terminal Value | 172,372 | |||||||||
| Present Terminal Value | 127,336 | |||||||||
| Enterprise Value | 139,605 | |||||||||
| Net Debt | 10,733 | |||||||||
| Equity Value | 128,872 | |||||||||
| Diluted Shares Outstanding, MM | 1,486 | |||||||||
| Equity Value Per Share | 86.73 |
What You Will Receive
- Comprehensive Financial Model: Boston Scientific’s actual data facilitates accurate DCF valuation.
- Complete Forecast Flexibility: Modify revenue growth, profit margins, WACC, and other essential variables.
- Real-Time Calculations: Automatic updates provide immediate insights as you implement changes.
- Professional-Grade Template: A polished Excel file crafted for high-quality valuation.
- Adjustable and Repeatable: Designed for adaptability, allowing for consistent use in detailed forecasts.
Key Features
- 🔍 Real-Life BSX Financials: Pre-filled historical and projected data for Boston Scientific Corporation (BSX).
- ✏️ Fully Customizable Inputs: Adjust all critical parameters (yellow cells) like WACC, growth %, and tax rates.
- 📊 Professional DCF Valuation: Built-in formulas calculate Boston Scientific’s intrinsic value using the Discounted Cash Flow method.
- ⚡ Instant Results: Visualize Boston Scientific’s valuation instantly after making changes.
- Scenario Analysis: Test and compare outcomes for various financial assumptions side-by-side.
How It Works
- Step 1: Download the prebuilt Excel template featuring Boston Scientific Corporation’s (BSX) data.
- Step 2: Navigate through the pre-filled sheets to familiarize yourself with the essential metrics.
- Step 3: Modify forecasts and assumptions in the editable yellow cells (WACC, growth, margins).
- Step 4: Instantly see the recalculated results, including Boston Scientific Corporation’s (BSX) intrinsic value.
- Step 5: Utilize the outputs to make informed investment decisions or create detailed reports.
Why Choose This Calculator?
- Accurate Data: Real Boston Scientific Corporation (BSX) financials ensure reliable valuation results.
- Customizable: Adjust key parameters like growth rates, WACC, and tax rates to match your projections.
- Time-Saving: Pre-built calculations eliminate the need to start from scratch.
- Professional-Grade Tool: Designed for investors, analysts, and consultants.
- User-Friendly: Intuitive layout and step-by-step instructions make it easy for all users.
Who Should Use This Product?
- Investors: Accurately estimate Boston Scientific Corporation’s (BSX) fair value before making investment decisions.
- CFOs: Leverage a professional-grade DCF model for financial reporting and analysis related to Boston Scientific Corporation (BSX).
- Consultants: Quickly adapt the template for valuation reports for clients focused on Boston Scientific Corporation (BSX).
- Entrepreneurs: Gain insights into financial modeling used by leading companies like Boston Scientific Corporation (BSX).
- Educators: Use it as a teaching tool to demonstrate valuation methodologies relevant to Boston Scientific Corporation (BSX).
What the Template Contains
- Preloaded BSX Data: Historical and projected financial data, including revenue, EBIT, and capital expenditures.
- DCF and WACC Models: Professional-grade sheets for calculating intrinsic value and Weighted Average Cost of Capital.
- Editable Inputs: Yellow-highlighted cells for adjusting revenue growth, tax rates, and discount rates.
- Financial Statements: Comprehensive annual and quarterly financials for deeper analysis.
- Key Ratios: Profitability, leverage, and efficiency ratios to evaluate performance.
- Dashboard and Charts: Visual summaries of valuation outcomes and assumptions.
Disclaimer
All information, articles, and product details provided on this website are for general informational and educational purposes only. We do not claim any ownership over, nor do we intend to infringe upon, any trademarks, copyrights, logos, brand names, or other intellectual property mentioned or depicted on this site. Such intellectual property remains the property of its respective owners, and any references here are made solely for identification or informational purposes, without implying any affiliation, endorsement, or partnership.
We make no representations or warranties, express or implied, regarding the accuracy, completeness, or suitability of any content or products presented. Nothing on this website should be construed as legal, tax, investment, financial, medical, or other professional advice. In addition, no part of this site—including articles or product references—constitutes a solicitation, recommendation, endorsement, advertisement, or offer to buy or sell any securities, franchises, or other financial instruments, particularly in jurisdictions where such activity would be unlawful.
All content is of a general nature and may not address the specific circumstances of any individual or entity. It is not a substitute for professional advice or services. Any actions you take based on the information provided here are strictly at your own risk. You accept full responsibility for any decisions or outcomes arising from your use of this website and agree to release us from any liability in connection with your use of, or reliance upon, the content or products found herein.