
|
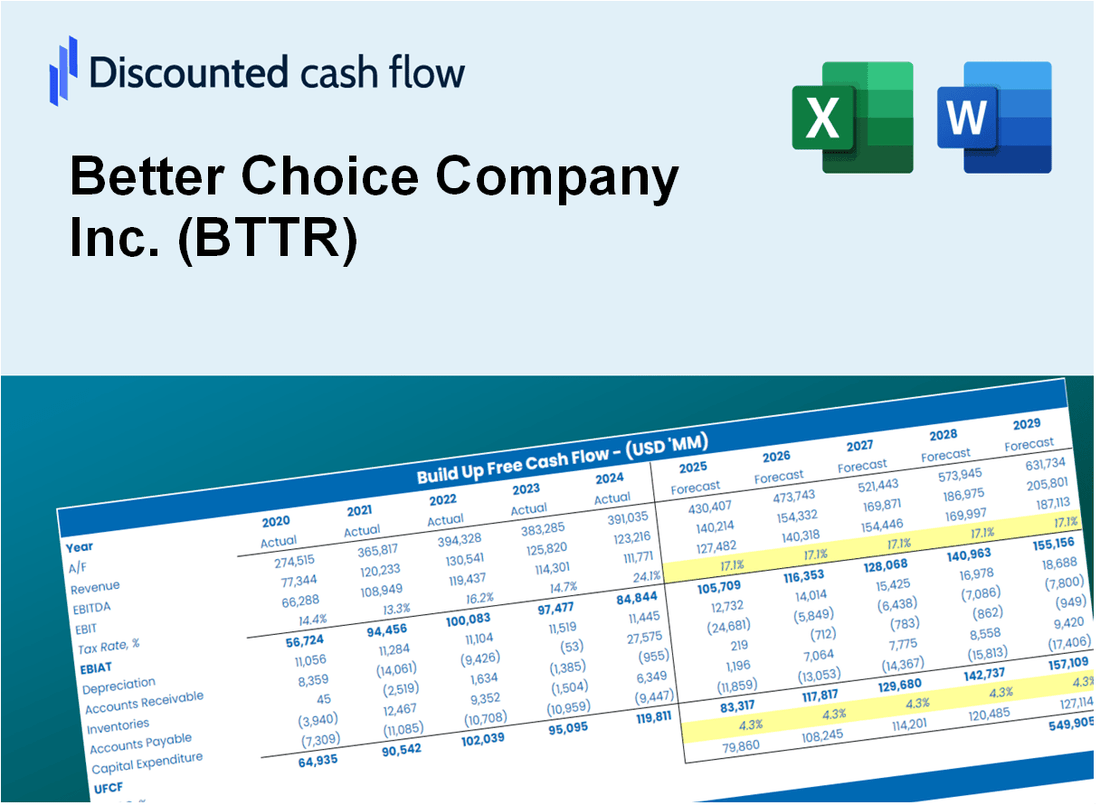
Valoración DCF de Better Choice Company Inc. (BTTR) |
Completamente Editable: Adáptelo A Sus Necesidades En Excel O Sheets
Diseño Profesional: Plantillas Confiables Y Estándares De La Industria
Predeterminadas Para Un Uso Rápido Y Eficiente
Compatible con MAC / PC, completamente desbloqueado
No Se Necesita Experiencia; Fáciles De Seguir
Better Choice Company Inc. (BTTR) Bundle
¡Explore Better Choice Company Inc. (BTTR) Potencial financiero con nuestra calculadora DCF fácil de usar! Simplemente ingrese sus suposiciones sobre el crecimiento, los márgenes y los costos para calcular el valor intrínseco de Better Choice Company Inc. (BTTR) y mejorar su enfoque de inversión.
What You Will Receive
- Flexible Input Options: Modify key assumptions (growth %, margins, WACC) to explore various scenarios.
- Current Market Data: Better Choice Company Inc. (BTTR)’s financial data pre-loaded to facilitate your analysis.
- Instant DCF Calculations: The template automatically computes Net Present Value (NPV) and intrinsic value for you.
- Tailored and Professional Design: A sleek Excel model that adjusts to meet your valuation requirements.
- Designed for Analysts and Investors: Perfect for evaluating projections, confirming strategies, and enhancing efficiency.
Key Features
- Comprehensive Data: Better Choice Company Inc.'s (BTTR) historical financial statements and detailed projections.
- Customizable Parameters: Modify WACC, tax rates, revenue growth, and EBITDA margins as needed.
- Real-Time Calculations: Observe the intrinsic value of Better Choice Company Inc. (BTTR) update instantly.
- Intuitive Visualizations: Dashboard graphs present valuation outcomes and essential metrics clearly.
- Designed for Precision: A reliable tool tailored for analysts, investors, and finance professionals.
How It Functions
- Download the Template: Gain immediate access to the Excel-based BTTR Valuation Model.
- Input Your Assumptions: Modify the yellow-highlighted cells for growth rates, WACC, margins, and other variables.
- Instant Calculations: The model automatically recalculates Better Choice Company Inc.'s intrinsic value.
- Test Scenarios: Experiment with various assumptions to assess potential changes in valuation.
- Analyze and Decide: Utilize the outcomes to inform your investment or financial strategies.
Why Choose Better Choice Company Inc. (BTTR)?
- Designed for Investors: A sophisticated tool tailored for investors, analysts, and financial advisors.
- Comprehensive Data: BTTR’s historical and projected financials included for precise analysis.
- Flexible Scenario Analysis: Easily test various forecasts and assumptions to see potential outcomes.
- Insightful Outputs: Automatically computes intrinsic value, NPV, and other essential metrics.
- User-Friendly: Intuitive step-by-step instructions make navigation simple.
Who Should Use Better Choice Company Inc. (BTTR)?
- Investors: Accurately estimate Better Choice Company Inc.'s fair value before making investment decisions.
- CFOs: Utilize a professional-grade DCF model for financial reporting and analysis related to Better Choice Company Inc. (BTTR).
- Consultants: Easily customize the template for valuation reports focused on Better Choice Company Inc. (BTTR) for clients.
- Entrepreneurs: Gain insights into financial modeling practices employed by successful companies, including Better Choice Company Inc. (BTTR).
- Educators: Use it as a teaching resource to illustrate valuation methodologies applicable to Better Choice Company Inc. (BTTR).
What the Template Contains
- Comprehensive DCF Model: Editable template featuring detailed valuation calculations tailored for Better Choice Company Inc. (BTTR).
- Real-World Data: Historical and projected financials for Better Choice Company Inc. (BTTR) preloaded for in-depth analysis.
- Customizable Parameters: Modify WACC, growth rates, and tax assumptions to explore various scenarios.
- Financial Statements: Complete annual and quarterly breakdowns providing deeper insights into Better Choice Company Inc. (BTTR).
- Key Ratios: Integrated analysis for assessing profitability, efficiency, and leverage specific to Better Choice Company Inc. (BTTR).
- Dashboard with Visual Outputs: Charts and tables designed for clear, actionable results related to Better Choice Company Inc. (BTTR).
Disclaimer
All information, articles, and product details provided on this website are for general informational and educational purposes only. We do not claim any ownership over, nor do we intend to infringe upon, any trademarks, copyrights, logos, brand names, or other intellectual property mentioned or depicted on this site. Such intellectual property remains the property of its respective owners, and any references here are made solely for identification or informational purposes, without implying any affiliation, endorsement, or partnership.
We make no representations or warranties, express or implied, regarding the accuracy, completeness, or suitability of any content or products presented. Nothing on this website should be construed as legal, tax, investment, financial, medical, or other professional advice. In addition, no part of this site—including articles or product references—constitutes a solicitation, recommendation, endorsement, advertisement, or offer to buy or sell any securities, franchises, or other financial instruments, particularly in jurisdictions where such activity would be unlawful.
All content is of a general nature and may not address the specific circumstances of any individual or entity. It is not a substitute for professional advice or services. Any actions you take based on the information provided here are strictly at your own risk. You accept full responsibility for any decisions or outcomes arising from your use of this website and agree to release us from any liability in connection with your use of, or reliance upon, the content or products found herein.