
|
Valoración DCF de Broadwind, Inc. (BWEN) |
Completamente Editable: Adáptelo A Sus Necesidades En Excel O Sheets
Diseño Profesional: Plantillas Confiables Y Estándares De La Industria
Predeterminadas Para Un Uso Rápido Y Eficiente
Compatible con MAC / PC, completamente desbloqueado
No Se Necesita Experiencia; Fáciles De Seguir
Broadwind, Inc. (BWEN) Bundle
¡Descubra el verdadero valor de Broadwind, Inc. (BWEN) con nuestra calculadora DCF avanzada! Ajuste los supuestos clave, explore varios escenarios y evalúe cómo los cambios afectan la valoración de Broadwind, todo dentro de una conveniente plantilla de Excel.
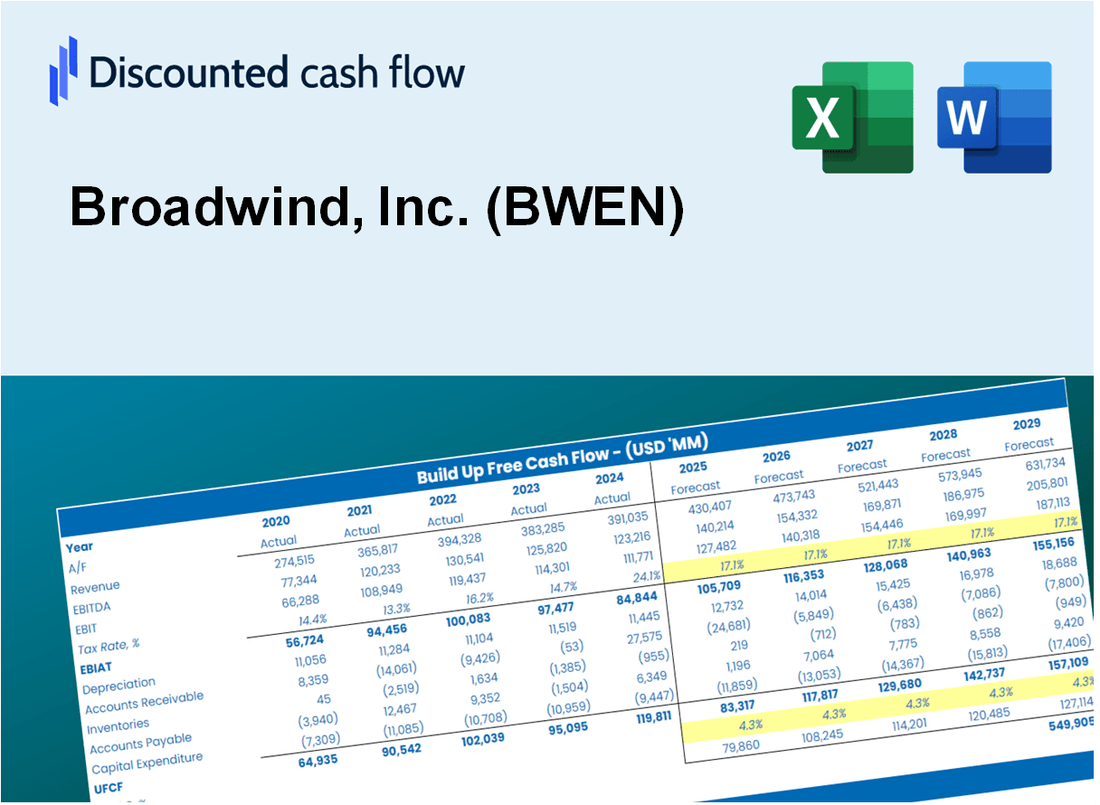
Discounted Cash Flow (DCF) - (USD MM)
| Year | AY1 2020 |
AY2 2021 |
AY3 2022 |
AY4 2023 |
AY5 2024 |
FY1 2025 |
FY2 2026 |
FY3 2027 |
FY4 2028 |
FY5 2029 |
|---|---|---|---|---|---|---|---|---|---|---|
| Revenue | 198.5 | 145.6 | 176.8 | 203.5 | 143.1 | 136.1 | 129.3 | 122.9 | 116.8 | 111.1 |
| Revenue Growth, % | 0 | -26.64 | 21.38 | 15.12 | -29.65 | -4.95 | -4.95 | -4.95 | -4.95 | -4.95 |
| EBITDA | 6.7 | 10.3 | -.4 | 17.5 | 11.0 | 7.2 | 6.9 | 6.5 | 6.2 | 5.9 |
| EBITDA, % | 3.38 | 7.1 | -0.23591 | 8.59 | 7.68 | 5.3 | 5.3 | 5.3 | 5.3 | 5.3 |
| Depreciation | 6.3 | 6.3 | 6.1 | 6.4 | 6.7 | 5.1 | 4.8 | 4.6 | 4.4 | 4.2 |
| Depreciation, % | 3.16 | 4.35 | 3.43 | 3.14 | 4.67 | 3.75 | 3.75 | 3.75 | 3.75 | 3.75 |
| EBIT | .4 | 4.0 | -6.5 | 11.1 | 4.3 | 2.1 | 2.0 | 1.9 | 1.8 | 1.7 |
| EBIT, % | 0.2126 | 2.75 | -3.66 | 5.45 | 3.01 | 1.55 | 1.55 | 1.55 | 1.55 | 1.55 |
| Total Cash | 3.4 | .9 | 12.7 | 1.1 | 7.7 | 4.2 | 4.0 | 3.8 | 3.6 | 3.4 |
| Total Cash, percent | .0 | .0 | .0 | .0 | .0 | .0 | .0 | .0 | .0 | .0 |
| Account Receivables | 17.6 | 15.4 | 19.0 | 27.7 | 13.5 | 14.5 | 13.8 | 13.1 | 12.4 | 11.8 |
| Account Receivables, % | 8.86 | 10.6 | 10.73 | 13.63 | 9.4 | 10.65 | 10.65 | 10.65 | 10.65 | 10.65 |
| Inventories | 26.7 | 33.4 | 44.3 | 37.4 | 40.0 | 29.3 | 27.9 | 26.5 | 25.2 | 23.9 |
| Inventories, % | 13.46 | 22.92 | 25.04 | 18.38 | 27.91 | 21.54 | 21.54 | 21.54 | 21.54 | 21.54 |
| Accounts Payable | 18.2 | 16.5 | 26.3 | 20.7 | 16.1 | 15.4 | 14.7 | 13.9 | 13.3 | 12.6 |
| Accounts Payable, % | 9.16 | 11.3 | 14.85 | 10.19 | 11.23 | 11.35 | 11.35 | 11.35 | 11.35 | 11.35 |
| Capital Expenditure | -1.5 | -1.7 | -3.1 | -6.4 | -3.6 | -2.6 | -2.4 | -2.3 | -2.2 | -2.1 |
| Capital Expenditure, % | -0.77936 | -1.17 | -1.75 | -3.15 | -2.53 | -1.88 | -1.88 | -1.88 | -1.88 | -1.88 |
| Tax Rate, % | 6.04 | 6.04 | 6.04 | 6.04 | 6.04 | 6.04 | 6.04 | 6.04 | 6.04 | 6.04 |
| EBITAT | .4 | 4.0 | -6.5 | 10.8 | 4.0 | 2.1 | 2.0 | 1.9 | 1.8 | 1.7 |
| Depreciation | ||||||||||
| Changes in Account Receivables | ||||||||||
| Changes in Inventories | ||||||||||
| Changes in Accounts Payable | ||||||||||
| Capital Expenditure | ||||||||||
| UFCF | -21.0 | 2.4 | -8.2 | 3.3 | 14.2 | 13.6 | 5.8 | 5.5 | 5.2 | 5.0 |
| WACC, % | 10.09 | 10.07 | 10.09 | 9.99 | 9.89 | 10.03 | 10.03 | 10.03 | 10.03 | 10.03 |
| PV UFCF | ||||||||||
| SUM PV UFCF | 27.9 | |||||||||
| Long Term Growth Rate, % | 2.00 | |||||||||
| Free cash flow (T + 1) | 5 | |||||||||
| Terminal Value | 63 | |||||||||
| Present Terminal Value | 39 | |||||||||
| Enterprise Value | 67 | |||||||||
| Net Debt | 28 | |||||||||
| Equity Value | 39 | |||||||||
| Diluted Shares Outstanding, MM | 22 | |||||||||
| Equity Value Per Share | 1.79 |
What You Will Get
- Comprehensive BWEN Financials: Access historical and projected data for precise valuation.
- Customizable Inputs: Adjust WACC, tax rates, revenue growth, and capital expenditures as needed.
- Dynamic Calculations: Intrinsic value and NPV are computed in real-time.
- Scenario Analysis: Explore various scenarios to assess Broadwind's future performance.
- User-Friendly Interface: Designed for industry professionals while remaining approachable for newcomers.
Key Features
- Comprehensive DCF Calculator: Features detailed unlevered and levered DCF valuation models tailored for Broadwind, Inc. (BWEN).
- WACC Calculator: Pre-configured Weighted Average Cost of Capital sheet with adjustable inputs for accurate financial analysis.
- Customizable Forecast Assumptions: Adjust growth rates, capital expenditures, and discount rates to reflect market conditions.
- Integrated Financial Ratios: Assess profitability, leverage, and efficiency ratios specifically for Broadwind, Inc. (BWEN).
- Interactive Dashboard and Charts: Visual representations that summarize essential valuation metrics for straightforward analysis.
How It Works
- Download: Obtain the pre-formatted Excel file containing Broadwind, Inc. (BWEN) financial data.
- Customize: Modify projections such as revenue growth, EBITDA %, and WACC to fit your analysis.
- Update Automatically: Watch as intrinsic value and NPV calculations refresh in real-time.
- Test Scenarios: Develop various forecasts and evaluate results side by side.
- Make Decisions: Leverage the valuation insights to inform your investment approach.
Why Choose This Calculator for Broadwind, Inc. (BWEN)?
- Accuracy: Utilizes real Broadwind financials for precise data.
- Flexibility: Built for users to easily test and adjust inputs as needed.
- Time-Saving: Avoid the complexity of creating a DCF model from the ground up.
- Professional-Grade: Crafted with the precision and usability expected at the CFO level.
- User-Friendly: Intuitive design makes it accessible for users without extensive financial modeling skills.
Who Should Use Broadwind, Inc. (BWEN)?
- Renewable Energy Investors: Develop comprehensive valuation models for investments in wind energy.
- Corporate Strategy Teams: Evaluate market scenarios to inform business decisions and growth strategies.
- Financial Consultants: Deliver precise valuation assessments for clients interested in Broadwind, Inc. (BWEN).
- Academic Institutions: Utilize current market data to teach and learn about financial modeling in the energy sector.
- Industry Analysts: Gain insights into how renewable energy companies like Broadwind, Inc. (BWEN) are valued in the marketplace.
What the Broadwind Template Includes
- Comprehensive DCF Model: Editable template featuring in-depth valuation calculations.
- Real-World Data: Broadwind, Inc.'s (BWEN) historical and projected financials preloaded for analysis.
- Customizable Parameters: Modify WACC, growth rates, and tax assumptions to explore various scenarios.
- Financial Statements: Complete annual and quarterly breakdowns for enhanced insights.
- Key Ratios: Integrated analysis for profitability, efficiency, and leverage metrics.
- Dashboard with Visual Outputs: Charts and tables providing clear, actionable results.
Disclaimer
All information, articles, and product details provided on this website are for general informational and educational purposes only. We do not claim any ownership over, nor do we intend to infringe upon, any trademarks, copyrights, logos, brand names, or other intellectual property mentioned or depicted on this site. Such intellectual property remains the property of its respective owners, and any references here are made solely for identification or informational purposes, without implying any affiliation, endorsement, or partnership.
We make no representations or warranties, express or implied, regarding the accuracy, completeness, or suitability of any content or products presented. Nothing on this website should be construed as legal, tax, investment, financial, medical, or other professional advice. In addition, no part of this site—including articles or product references—constitutes a solicitation, recommendation, endorsement, advertisement, or offer to buy or sell any securities, franchises, or other financial instruments, particularly in jurisdictions where such activity would be unlawful.
All content is of a general nature and may not address the specific circumstances of any individual or entity. It is not a substitute for professional advice or services. Any actions you take based on the information provided here are strictly at your own risk. You accept full responsibility for any decisions or outcomes arising from your use of this website and agree to release us from any liability in connection with your use of, or reliance upon, the content or products found herein.