
|
Valoración DCF de Bowman Consulting Group Ltd. (BWMN) |
Completamente Editable: Adáptelo A Sus Necesidades En Excel O Sheets
Diseño Profesional: Plantillas Confiables Y Estándares De La Industria
Predeterminadas Para Un Uso Rápido Y Eficiente
Compatible con MAC / PC, completamente desbloqueado
No Se Necesita Experiencia; Fáciles De Seguir
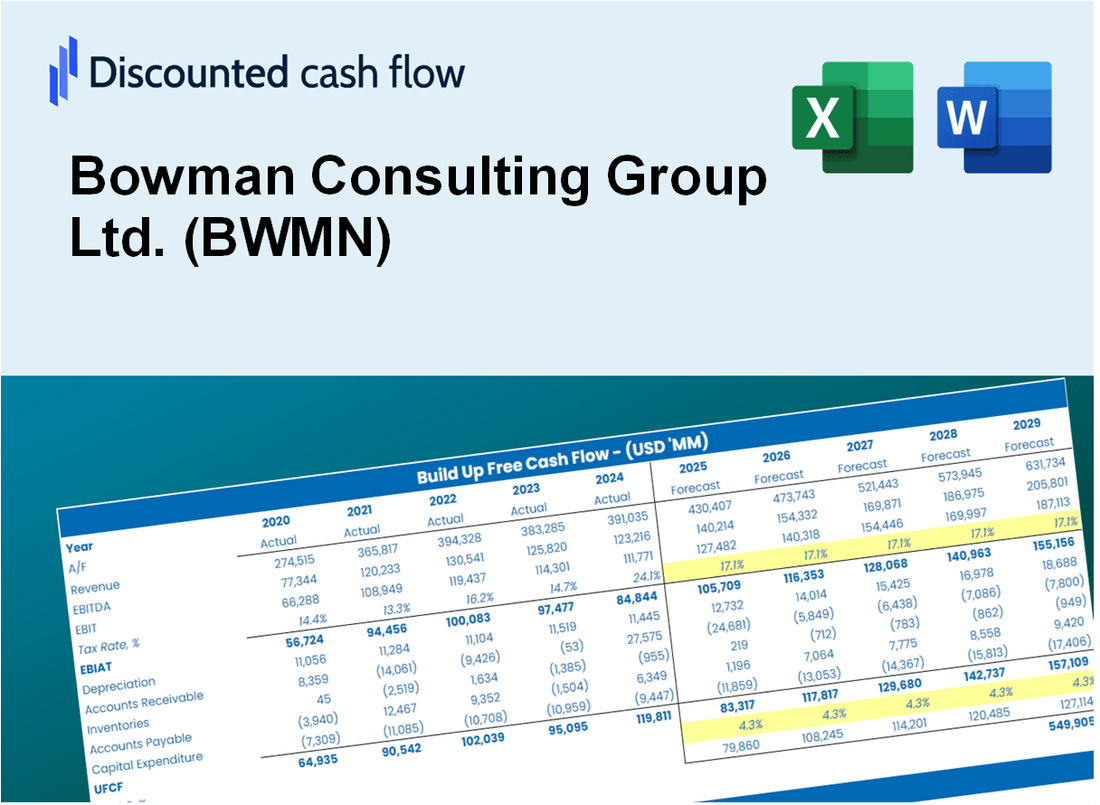
Bowman Consulting Group Ltd. (BWMN) Bundle
Como inversor o analista, esta calculadora DCF (BWMN) sirve como su herramienta esencial para una valoración precisa. Cargados con datos reales de Bowman Consulting Group Ltd., puede modificar los pronósticos y observar los efectos en tiempo real.
Discounted Cash Flow (DCF) - (USD MM)
| Year | AY1 2020 |
AY2 2021 |
AY3 2022 |
AY4 2023 |
AY5 2024 |
FY1 2025 |
FY2 2026 |
FY3 2027 |
FY4 2028 |
FY5 2029 |
|---|---|---|---|---|---|---|---|---|---|---|
| Revenue | 122.0 | 150.0 | 261.7 | 346.3 | 426.6 | 589.6 | 815.0 | 1,126.6 | 1,557.3 | 2,152.6 |
| Revenue Growth, % | 0 | 22.91 | 74.51 | 32.3 | 23.19 | 38.23 | 38.23 | 38.23 | 38.23 | 38.23 |
| EBITDA | 4.0 | 6.4 | 17.3 | 17.7 | 26.0 | 29.9 | 41.4 | 57.2 | 79.0 | 109.3 |
| EBITDA, % | 3.31 | 4.27 | 6.61 | 5.1 | 6.09 | 5.08 | 5.08 | 5.08 | 5.08 | 5.08 |
| Depreciation | 2.3 | 6.4 | 12.3 | 18.7 | 28.4 | 27.0 | 37.3 | 51.5 | 71.2 | 98.5 |
| Depreciation, % | 1.87 | 4.25 | 4.68 | 5.41 | 6.67 | 4.57 | 4.57 | 4.57 | 4.57 | 4.57 |
| EBIT | 1.8 | .0 | 5.0 | -1.1 | -2.5 | 3.0 | 4.1 | 5.6 | 7.8 | 10.8 |
| EBIT, % | 1.44 | 0.0253384 | 1.93 | -0.30815 | -0.58069 | 0.50111 | 0.50111 | 0.50111 | 0.50111 | 0.50111 |
| Total Cash | .4 | 20.6 | 13.3 | 20.7 | 6.7 | 31.5 | 43.5 | 60.1 | 83.1 | 114.9 |
| Total Cash, percent | .0 | .0 | .0 | .0 | .0 | .0 | .0 | .0 | .0 | .0 |
| Account Receivables | 32.4 | 48.9 | 81.8 | 122.3 | 150.4 | 189.9 | 262.5 | 362.9 | 501.6 | 693.3 |
| Account Receivables, % | 26.59 | 32.63 | 31.25 | 35.32 | 35.25 | 32.21 | 32.21 | 32.21 | 32.21 | 32.21 |
| Inventories | .0 | .0 | .0 | .0 | .0 | .0 | .0 | .0 | .0 | .0 |
| Inventories, % | 0 | 0 | 0 | 0 | 0 | 0 | 0 | 0 | 0 | 0 |
| Accounts Payable | .0 | .0 | .0 | 44.0 | 51.6 | 29.3 | 40.4 | 55.9 | 77.3 | 106.8 |
| Accounts Payable, % | 0 | 0 | 0 | 12.71 | 12.1 | 4.96 | 4.96 | 4.96 | 4.96 | 4.96 |
| Capital Expenditure | -1.3 | -.9 | -.9 | -2.1 | -.6 | -3.3 | -4.6 | -6.3 | -8.7 | -12.0 |
| Capital Expenditure, % | -1.1 | -0.60345 | -0.34465 | -0.60447 | -0.14675 | -0.5595 | -0.5595 | -0.5595 | -0.5595 | -0.5595 |
| Tax Rate, % | 131.34 | 131.34 | 131.34 | 131.34 | 131.34 | 131.34 | 131.34 | 131.34 | 131.34 | 131.34 |
| EBITAT | .9 | .0 | 14.5 | -1.1 | .8 | 1.5 | 2.0 | 2.8 | 3.9 | 5.4 |
| Depreciation | ||||||||||
| Changes in Account Receivables | ||||||||||
| Changes in Inventories | ||||||||||
| Changes in Accounts Payable | ||||||||||
| Capital Expenditure | ||||||||||
| UFCF | -30.6 | -11.0 | -7.0 | 19.0 | 8.1 | -36.8 | -26.6 | -36.8 | -50.9 | -70.4 |
| WACC, % | 8.37 | 7.81 | 8.93 | 8.93 | 7.81 | 8.37 | 8.37 | 8.37 | 8.37 | 8.37 |
| PV UFCF | ||||||||||
| SUM PV UFCF | -169.5 | |||||||||
| Long Term Growth Rate, % | 4.00 | |||||||||
| Free cash flow (T + 1) | -73 | |||||||||
| Terminal Value | -1,674 | |||||||||
| Present Terminal Value | -1,120 | |||||||||
| Enterprise Value | -1,289 | |||||||||
| Net Debt | 144 | |||||||||
| Equity Value | -1,433 | |||||||||
| Diluted Shares Outstanding, MM | 16 | |||||||||
| Equity Value Per Share | -88.84 |
What You Will Receive
- Adjustable Forecast Parameters: Effortlessly modify assumptions (growth %, margins, WACC) to explore various scenarios.
- Industry-Specific Data: Bowman Consulting Group Ltd.’s (BWMN) financial information pre-loaded to facilitate your analysis.
- Instant DCF Calculations: The template automatically computes Net Present Value (NPV) and intrinsic value for your convenience.
- Tailored and Professional Design: A sleek Excel model that aligns with your valuation requirements.
- Designed for Analysts and Investors: Perfect for assessing forecasts, validating strategies, and enhancing efficiency.
Key Features
- Customizable Project Parameters: Adjust essential metrics such as project timelines, resource allocation, and budget estimates.
- Instant Project Valuation: Provides immediate calculations for project feasibility, ROI, and other key financial metrics.
- Industry-Leading Precision: Leverages Bowman's extensive market data for accurate project assessments.
- Effortless Scenario Planning: Evaluate various project scenarios and analyze potential outcomes with ease.
- Efficiency Booster: Streamline the project management process without the hassle of starting from scratch.
How It Works
- Step 1: Download the prebuilt Excel template featuring Bowman Consulting Group Ltd. (BWMN) data.
- Step 2: Navigate through the pre-filled sheets to grasp the essential metrics.
- Step 3: Modify forecasts and assumptions in the editable yellow cells (WACC, growth, margins).
- Step 4: Instantly access recalibrated results, including Bowman Consulting Group Ltd.'s (BWMN) intrinsic value.
- Step 5: Make well-informed investment choices or create reports based on the outputs.
Why Choose Bowman Consulting Group Ltd. (BWMN)?
- Expertise at Your Fingertips: Access specialized consulting services tailored to your needs.
- Enhance Decision-Making: Data-driven insights help you make informed strategic choices.
- Custom Solutions: Our services can be adapted to meet the unique requirements of your projects.
- User-Friendly Experience: Clear communication and straightforward processes ensure seamless collaboration.
- Respected in the Industry: Trusted by clients for our commitment to quality and client satisfaction.
Who Should Use This Product?
- Individual Investors: Gain insights to make informed decisions about investing in Bowman Consulting Group Ltd. (BWMN).
- Financial Analysts: Enhance your analysis with comprehensive financial models tailored for Bowman Consulting Group Ltd. (BWMN).
- Consultants: Provide clients with accurate valuation assessments of Bowman Consulting Group Ltd. (BWMN) efficiently.
- Business Owners: Learn from the valuation strategies of Bowman Consulting Group Ltd. (BWMN) to improve your own business approach.
- Finance Students: Explore practical valuation methods using real data from Bowman Consulting Group Ltd. (BWMN).
What the Template Contains
- Preloaded BWMN Data: Historical and projected financial data, including revenue, EBIT, and capital expenditures.
- DCF and WACC Models: Professional-grade sheets for calculating intrinsic value and Weighted Average Cost of Capital.
- Editable Inputs: Yellow-highlighted cells for adjusting revenue growth, tax rates, and discount rates.
- Financial Statements: Comprehensive annual and quarterly financials for deeper analysis.
- Key Ratios: Profitability, leverage, and efficiency ratios to evaluate performance.
- Dashboard and Charts: Visual summaries of valuation outcomes and assumptions.
Disclaimer
All information, articles, and product details provided on this website are for general informational and educational purposes only. We do not claim any ownership over, nor do we intend to infringe upon, any trademarks, copyrights, logos, brand names, or other intellectual property mentioned or depicted on this site. Such intellectual property remains the property of its respective owners, and any references here are made solely for identification or informational purposes, without implying any affiliation, endorsement, or partnership.
We make no representations or warranties, express or implied, regarding the accuracy, completeness, or suitability of any content or products presented. Nothing on this website should be construed as legal, tax, investment, financial, medical, or other professional advice. In addition, no part of this site—including articles or product references—constitutes a solicitation, recommendation, endorsement, advertisement, or offer to buy or sell any securities, franchises, or other financial instruments, particularly in jurisdictions where such activity would be unlawful.
All content is of a general nature and may not address the specific circumstances of any individual or entity. It is not a substitute for professional advice or services. Any actions you take based on the information provided here are strictly at your own risk. You accept full responsibility for any decisions or outcomes arising from your use of this website and agree to release us from any liability in connection with your use of, or reliance upon, the content or products found herein.