
|
Cairn Homes plc (C5H.IR) Valoración de DCF |
Completamente Editable: Adáptelo A Sus Necesidades En Excel O Sheets
Diseño Profesional: Plantillas Confiables Y Estándares De La Industria
Predeterminadas Para Un Uso Rápido Y Eficiente
Compatible con MAC / PC, completamente desbloqueado
No Se Necesita Experiencia; Fáciles De Seguir
Cairn Homes plc (C5H.IR) Bundle
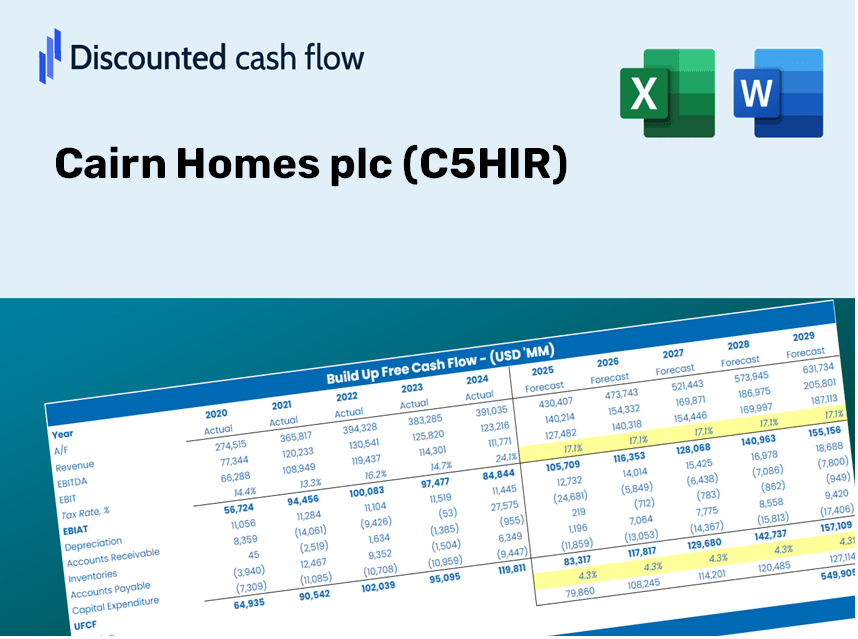
¡Simplifique la valoración de Cairn Homes PLC con esta calculadora DCF personalizable! Con el Real Cairn Homes PLC Financials y las entradas de pronóstico ajustables, puede probar escenarios y descubrir el valor razonable de Cairn Homes PLC en minutos.
Discounted Cash Flow (DCF) - (USD MM)
| Year | AY1 2020 |
AY2 2021 |
AY3 2022 |
AY4 2023 |
AY5 2024 |
FY1 2025 |
FY2 2026 |
FY3 2027 |
FY4 2028 |
FY5 2029 |
|---|---|---|---|---|---|---|---|---|---|---|
| Revenue | 260.6 | 424.1 | 623.4 | 664.0 | 859.7 | 1,172.9 | 1,600.2 | 2,183.1 | 2,978.5 | 4,063.6 |
| Revenue Growth, % | 0 | 62.75 | 46.99 | 6.52 | 29.46 | 36.43 | 36.43 | 36.43 | 36.43 | 36.43 |
| EBITDA | 25.0 | 59.2 | 105.8 | 115.1 | 152.9 | 177.5 | 242.1 | 330.3 | 450.6 | 614.8 |
| EBITDA, % | 9.6 | 13.96 | 16.98 | 17.33 | 17.78 | 15.13 | 15.13 | 15.13 | 15.13 | 15.13 |
| Depreciation | .7 | .8 | 1.8 | 2.2 | 2.7 | 3.3 | 4.4 | 6.1 | 8.3 | 11.3 |
| Depreciation, % | 0.26691 | 0.19081 | 0.28606 | 0.32528 | 0.31726 | 0.27726 | 0.27726 | 0.27726 | 0.27726 | 0.27726 |
| EBIT | 24.3 | 58.4 | 104.0 | 112.9 | 150.1 | 174.2 | 237.7 | 324.3 | 442.4 | 603.6 |
| EBIT, % | 9.33 | 13.77 | 16.69 | 17 | 17.46 | 14.85 | 14.85 | 14.85 | 14.85 | 14.85 |
| Total Cash | 34.5 | 40.0 | 21.7 | 25.6 | 27.6 | 78.0 | 106.4 | 145.1 | 198.0 | 270.1 |
| Total Cash, percent | .0 | .0 | .0 | .0 | .0 | .0 | .0 | .0 | .0 | .0 |
| Account Receivables | 10.5 | 27.6 | 19.4 | 52.9 | 140.2 | 89.0 | 121.5 | 165.7 | 226.1 | 308.5 |
| Account Receivables, % | 4.04 | 6.52 | 3.12 | 7.97 | 16.31 | 7.59 | 7.59 | 7.59 | 7.59 | 7.59 |
| Inventories | 968.2 | 940.0 | 967.3 | 943.4 | 862.1 | 1,172.9 | 1,600.2 | 2,183.1 | 2,978.5 | 4,063.6 |
| Inventories, % | 371.56 | 221.65 | 155.18 | 142.08 | 100.29 | 100 | 100 | 100 | 100 | 100 |
| Accounts Payable | 15.3 | 21.1 | 18.0 | 22.1 | 26.9 | 47.3 | 64.5 | 88.0 | 120.1 | 163.9 |
| Accounts Payable, % | 5.87 | 4.97 | 2.88 | 3.32 | 3.13 | 4.03 | 4.03 | 4.03 | 4.03 | 4.03 |
| Capital Expenditure | -.2 | -1.5 | -7.7 | -4.1 | -4.4 | -6.5 | -8.9 | -12.2 | -16.6 | -22.7 |
| Capital Expenditure, % | -0.07521959 | -0.35181 | -1.23 | -0.61594 | -0.51171 | -0.55754 | -0.55754 | -0.55754 | -0.55754 | -0.55754 |
| Tax Rate, % | 15.05 | 15.05 | 15.05 | 15.05 | 15.05 | 15.05 | 15.05 | 15.05 | 15.05 | 15.05 |
| EBITAT | 20.9 | 50.3 | 90.2 | 97.0 | 127.5 | 149.7 | 204.2 | 278.6 | 380.1 | 518.6 |
| Depreciation | ||||||||||
| Changes in Account Receivables | ||||||||||
| Changes in Inventories | ||||||||||
| Changes in Accounts Payable | ||||||||||
| Capital Expenditure | ||||||||||
| UFCF | -942.0 | 66.4 | 62.0 | 89.6 | 124.7 | -92.8 | -242.8 | -331.2 | -451.9 | -616.6 |
| WACC, % | 6.88 | 6.88 | 6.89 | 6.88 | 6.87 | 6.88 | 6.88 | 6.88 | 6.88 | 6.88 |
| PV UFCF | ||||||||||
| SUM PV UFCF | -1,359.1 | |||||||||
| Long Term Growth Rate, % | 2.00 | |||||||||
| Free cash flow (T + 1) | -629 | |||||||||
| Terminal Value | -12,890 | |||||||||
| Present Terminal Value | -9,243 | |||||||||
| Enterprise Value | -10,602 | |||||||||
| Net Debt | 161 | |||||||||
| Equity Value | -10,763 | |||||||||
| Diluted Shares Outstanding, MM | 645 | |||||||||
| Equity Value Per Share | -16.69 |
What You Will Receive
- Customizable Excel Template: A fully adaptable Excel-based DCF Calculator featuring pre-filled financial data for Cairn Homes plc (C5HIR).
- Accurate Data: Historical figures and forward-looking projections (highlighted in the yellow cells).
- Flexible Forecasting: Adjust key assumptions such as revenue growth, EBITDA margin, and WACC.
- Instant Calculations: Quickly observe how your inputs affect the valuation of Cairn Homes plc (C5HIR).
- Professional Resource: Designed for investors, CFOs, consultants, and financial analysts.
- User-Friendly Interface: Organized for easy navigation and understanding, complete with step-by-step guidance.
Key Features
- 🔍 Real-Life C5HIR Financials: Pre-filled historical and projected financial data for Cairn Homes plc.
- ✏️ Fully Customizable Inputs: Modify all essential parameters (yellow cells) such as WACC, growth %, and tax rates.
- 📊 Professional DCF Valuation: Integrated formulas compute Cairn's intrinsic value using the Discounted Cash Flow approach.
- ⚡ Instant Results: Immediately visualize Cairn's valuation after making any adjustments.
- Scenario Analysis: Explore and compare outcomes based on different financial assumptions side-by-side.
How It Works
- Download the Template: Gain immediate access to the Excel-based Cairn Homes plc (C5HIR) DCF Calculator.
- Input Your Assumptions: Modify the yellow-highlighted cells to set parameters such as growth rates, WACC, margins, and more.
- Instant Calculations: The model will automatically compute the intrinsic value of Cairn Homes plc (C5HIR).
- Test Scenarios: Experiment with various assumptions to see how they affect potential valuations.
- Analyze and Decide: Leverage the results to inform your investment or financial analyses.
Why Opt for This Calculator?
- User-Friendly Interface: Crafted for both novices and seasoned users.
- Customizable Inputs: Easily adjust parameters to suit your specific analysis.
- Real-Time Insights: Observe immediate changes to Cairn Homes plc’s valuation as you edit inputs.
- Pre-Configured: Comes with Cairn Homes plc’s (C5HIR) actual financial figures for swift assessments.
- Endorsed by Experts: Utilized by investors and analysts for making knowledgeable choices.
Who Can Benefit from This Product?
- Real Estate Students: Master valuation methods and apply them with actual market data.
- Researchers: Integrate professional valuation models into academic studies or projects.
- Property Investors: Validate your investment strategies and evaluate valuation results for Cairn Homes plc (C5HIR).
- Market Analysts: Enhance your analysis process with a customizable, ready-to-use DCF model.
- Entrepreneurs: Discover how major public real estate firms like Cairn Homes plc (C5HIR) are appraised.
Contents of the Template
- Preloaded C5HIR Data: Historical and projected financial data, encompassing revenue, EBIT, and capital expenditures.
- DCF and WACC Models: High-quality sheets designed for calculating intrinsic value and Weighted Average Cost of Capital.
- Editable Inputs: Cells highlighted in yellow for modifying revenue growth, tax rates, and discount rates.
- Financial Statements: Detailed annual and quarterly financials for in-depth analysis.
- Key Ratios: Ratios for profitability, leverage, and efficiency to assess performance.
- Dashboard and Charts: Visual representations of valuation results and underlying assumptions.
Disclaimer
All information, articles, and product details provided on this website are for general informational and educational purposes only. We do not claim any ownership over, nor do we intend to infringe upon, any trademarks, copyrights, logos, brand names, or other intellectual property mentioned or depicted on this site. Such intellectual property remains the property of its respective owners, and any references here are made solely for identification or informational purposes, without implying any affiliation, endorsement, or partnership.
We make no representations or warranties, express or implied, regarding the accuracy, completeness, or suitability of any content or products presented. Nothing on this website should be construed as legal, tax, investment, financial, medical, or other professional advice. In addition, no part of this site—including articles or product references—constitutes a solicitation, recommendation, endorsement, advertisement, or offer to buy or sell any securities, franchises, or other financial instruments, particularly in jurisdictions where such activity would be unlawful.
All content is of a general nature and may not address the specific circumstances of any individual or entity. It is not a substitute for professional advice or services. Any actions you take based on the information provided here are strictly at your own risk. You accept full responsibility for any decisions or outcomes arising from your use of this website and agree to release us from any liability in connection with your use of, or reliance upon, the content or products found herein.