
|
Valoración DCF de The Cheesecake Factory Incorporated (CAKE) |
Completamente Editable: Adáptelo A Sus Necesidades En Excel O Sheets
Diseño Profesional: Plantillas Confiables Y Estándares De La Industria
Predeterminadas Para Un Uso Rápido Y Eficiente
Compatible con MAC / PC, completamente desbloqueado
No Se Necesita Experiencia; Fáciles De Seguir
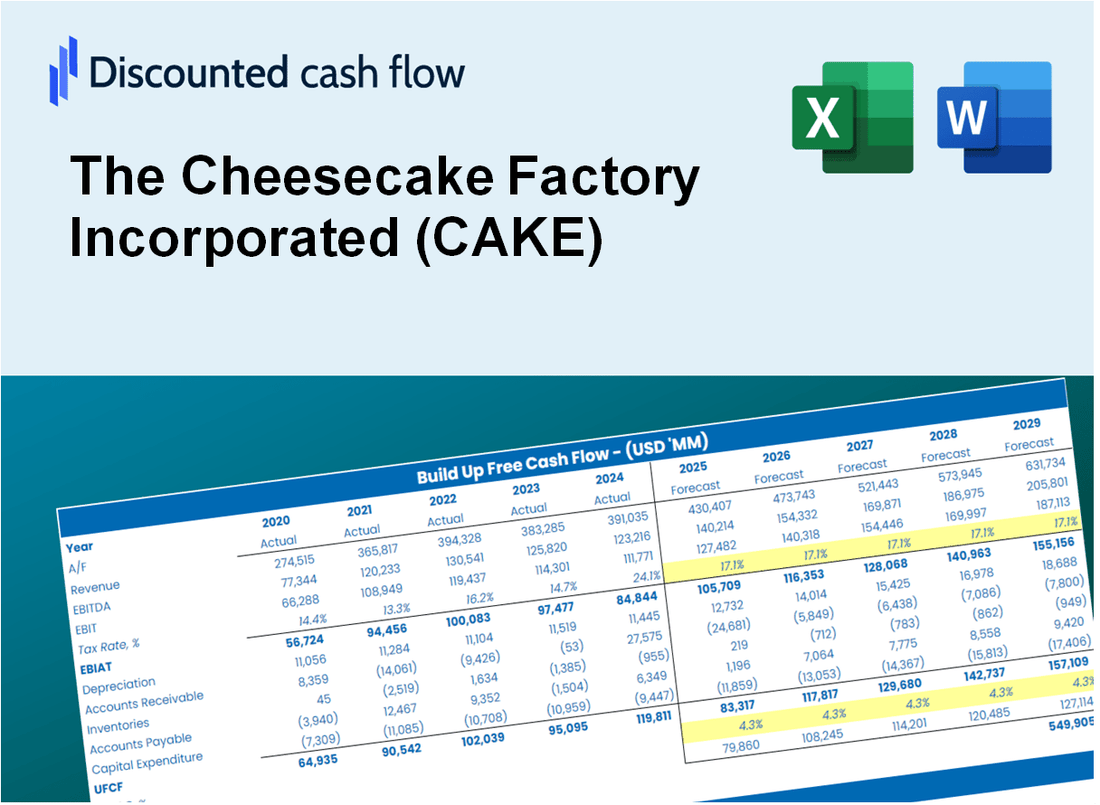
The Cheesecake Factory Incorporated (CAKE) Bundle
¡Descubra el verdadero valor de la fábrica de tarta de queso Incorporated (pastel) con nuestra calculadora DCF de nivel experto! Ajuste los supuestos clave, explore varios escenarios y evalúe cómo las modificaciones afectan la valoración de la fábrica de tarta de queso incorporada (pastel), todo dentro de una plantilla de Excel integral.
Discounted Cash Flow (DCF) - (USD MM)
| Year | AY1 2020 |
AY2 2021 |
AY3 2022 |
AY4 2023 |
AY5 2024 |
FY1 2025 |
FY2 2026 |
FY3 2027 |
FY4 2028 |
FY5 2029 |
|---|---|---|---|---|---|---|---|---|---|---|
| Revenue | 1,983.2 | 2,927.5 | 3,303.2 | 3,439.5 | 3,581.7 | 4,196.9 | 4,917.8 | 5,762.6 | 6,752.4 | 7,912.2 |
| Revenue Growth, % | 0 | 47.62 | 12.83 | 4.13 | 4.13 | 17.18 | 17.18 | 17.18 | 17.18 | 17.18 |
| EBITDA | -255.9 | 208.5 | 174.5 | 202.9 | 282.9 | 111.6 | 130.8 | 153.3 | 179.6 | 210.4 |
| EBITDA, % | -12.9 | 7.12 | 5.28 | 5.9 | 7.9 | 2.66 | 2.66 | 2.66 | 2.66 | 2.66 |
| Depreciation | 91.5 | 89.3 | 91.3 | 93.1 | 101.5 | 134.0 | 157.0 | 184.0 | 215.6 | 252.7 |
| Depreciation, % | 4.61 | 3.05 | 2.76 | 2.71 | 2.83 | 3.19 | 3.19 | 3.19 | 3.19 | 3.19 |
| EBIT | -347.4 | 119.3 | 83.2 | 109.8 | 181.5 | -22.4 | -26.2 | -30.8 | -36.0 | -42.2 |
| EBIT, % | -17.52 | 4.07 | 2.52 | 3.19 | 5.07 | -0.53377 | -0.53377 | -0.53377 | -0.53377 | -0.53377 |
| Total Cash | 154.1 | 189.6 | 114.8 | 56.3 | 84.2 | 182.2 | 213.5 | 250.2 | 293.2 | 343.5 |
| Total Cash, percent | .0 | .0 | .0 | .0 | .0 | .0 | .0 | .0 | .0 | .0 |
| Account Receivables | 130.6 | 136.7 | 146.9 | 142.9 | 89.4 | 187.6 | 219.9 | 257.6 | 301.9 | 353.7 |
| Account Receivables, % | 6.59 | 4.67 | 4.45 | 4.15 | 2.5 | 4.47 | 4.47 | 4.47 | 4.47 | 4.47 |
| Inventories | 39.3 | 42.8 | 55.6 | 57.7 | 64.5 | 72.2 | 84.6 | 99.2 | 116.2 | 136.2 |
| Inventories, % | 1.98 | 1.46 | 1.68 | 1.68 | 1.8 | 1.72 | 1.72 | 1.72 | 1.72 | 1.72 |
| Accounts Payable | 58.4 | 54.1 | 66.6 | 63.2 | 62.1 | 87.1 | 102.1 | 119.6 | 140.2 | 164.3 |
| Accounts Payable, % | 2.95 | 1.85 | 2.02 | 1.84 | 1.73 | 2.08 | 2.08 | 2.08 | 2.08 | 2.08 |
| Capital Expenditure | -50.9 | -67.5 | -113.1 | -153.2 | -160.4 | -144.6 | -169.5 | -198.6 | -232.7 | -272.7 |
| Capital Expenditure, % | -2.57 | -2.31 | -3.43 | -4.45 | -4.48 | -3.45 | -3.45 | -3.45 | -3.45 | -3.45 |
| Tax Rate, % | 8.34 | 8.34 | 8.34 | 8.34 | 8.34 | 8.34 | 8.34 | 8.34 | 8.34 | 8.34 |
| EBITAT | -247.2 | 120.5 | 109.1 | 111.2 | 166.3 | -20.7 | -24.3 | -28.5 | -33.4 | -39.1 |
| Depreciation | ||||||||||
| Changes in Account Receivables | ||||||||||
| Changes in Inventories | ||||||||||
| Changes in Accounts Payable | ||||||||||
| Capital Expenditure | ||||||||||
| UFCF | -318.1 | 128.3 | 76.8 | 49.6 | 152.9 | -112.2 | -66.4 | -77.8 | -91.2 | -106.8 |
| WACC, % | 6.18 | 6.62 | 6.62 | 6.62 | 6.49 | 6.51 | 6.51 | 6.51 | 6.51 | 6.51 |
| PV UFCF | ||||||||||
| SUM PV UFCF | -377.1 | |||||||||
| Long Term Growth Rate, % | 3.50 | |||||||||
| Free cash flow (T + 1) | -111 | |||||||||
| Terminal Value | -3,676 | |||||||||
| Present Terminal Value | -2,682 | |||||||||
| Enterprise Value | -3,059 | |||||||||
| Net Debt | 1,824 | |||||||||
| Equity Value | -4,883 | |||||||||
| Diluted Shares Outstanding, MM | 49 | |||||||||
| Equity Value Per Share | -99.71 |
What You Will Get
- Editable Excel Template: A fully customizable Excel-based DCF Calculator featuring pre-filled real CAKE financials.
- Real-World Data: Historical data and forward-looking estimates (as illustrated in the yellow cells).
- Forecast Flexibility: Adjust forecast assumptions such as revenue growth, EBITDA %, and WACC.
- Automatic Calculations: Instantly observe how your inputs affect The Cheesecake Factory’s valuation.
- Professional Tool: Designed for investors, CFOs, consultants, and financial analysts.
- User-Friendly Design: Organized for clarity and ease of use, complete with step-by-step instructions.
Key Features
- Comprehensive DCF Calculator: Offers detailed unlevered and levered DCF valuation models tailored for The Cheesecake Factory (CAKE).
- WACC Calculator: Features a pre-built Weighted Average Cost of Capital sheet with adjustable inputs for accurate analysis.
- Customizable Forecast Assumptions: Easily modify growth rates, capital expenditures, and discount rates to fit your projections.
- Integrated Financial Ratios: Evaluate profitability, leverage, and efficiency ratios specific to The Cheesecake Factory (CAKE).
- Interactive Dashboard and Charts: Visual representations summarize essential valuation metrics for straightforward analysis.
How It Works
- Step 1: Download the Excel file.
- Step 2: Review pre-entered The Cheesecake Factory (CAKE) data (historical and projected).
- Step 3: Adjust key assumptions (yellow cells) based on your analysis.
- Step 4: View automatic recalculations for The Cheesecake Factory’s intrinsic value.
- Step 5: Use the outputs for investment decisions or reporting.
Why Choose This Calculator for The Cheesecake Factory (CAKE)?
- Comprehensive Tool: Combines DCF, WACC, and financial ratio analyses tailored for CAKE.
- Customizable Inputs: Modify yellow-highlighted cells to explore different financial scenarios for The Cheesecake Factory.
- Detailed Insights: Automatically computes the intrinsic value and Net Present Value for CAKE.
- Preloaded Data: Includes historical and forecasted data for accurate analysis of The Cheesecake Factory.
- Professional Quality: Perfect for financial analysts, investors, and business consultants focusing on CAKE.
Who Should Use This Product?
- Investors: Evaluate The Cheesecake Factory's (CAKE) market value before making investment decisions.
- CFOs and Financial Analysts: Optimize valuation methods and assess financial forecasts for The Cheesecake Factory.
- Restaurant Entrepreneurs: Understand how established brands like The Cheesecake Factory are valued in the industry.
- Consultants: Create detailed valuation reports for clients in the food and beverage sector.
- Students and Educators: Utilize current data to learn and teach valuation principles relevant to the restaurant business.
What the Template Contains
- Pre-Filled DCF Model: The Cheesecake Factory's (CAKE) financial data preloaded for immediate use.
- WACC Calculator: Detailed calculations for Weighted Average Cost of Capital.
- Financial Ratios: Evaluate The Cheesecake Factory's (CAKE) profitability, leverage, and efficiency.
- Editable Inputs: Change assumptions such as growth, margins, and CAPEX to fit your scenarios.
- Financial Statements: Annual and quarterly reports to support detailed analysis.
- Interactive Dashboard: Easily visualize key valuation metrics and results.
Disclaimer
All information, articles, and product details provided on this website are for general informational and educational purposes only. We do not claim any ownership over, nor do we intend to infringe upon, any trademarks, copyrights, logos, brand names, or other intellectual property mentioned or depicted on this site. Such intellectual property remains the property of its respective owners, and any references here are made solely for identification or informational purposes, without implying any affiliation, endorsement, or partnership.
We make no representations or warranties, express or implied, regarding the accuracy, completeness, or suitability of any content or products presented. Nothing on this website should be construed as legal, tax, investment, financial, medical, or other professional advice. In addition, no part of this site—including articles or product references—constitutes a solicitation, recommendation, endorsement, advertisement, or offer to buy or sell any securities, franchises, or other financial instruments, particularly in jurisdictions where such activity would be unlawful.
All content is of a general nature and may not address the specific circumstances of any individual or entity. It is not a substitute for professional advice or services. Any actions you take based on the information provided here are strictly at your own risk. You accept full responsibility for any decisions or outcomes arising from your use of this website and agree to release us from any liability in connection with your use of, or reliance upon, the content or products found herein.