
|
Valoración DCF de Pathward Financial, Inc. (CASH) |
Completamente Editable: Adáptelo A Sus Necesidades En Excel O Sheets
Diseño Profesional: Plantillas Confiables Y Estándares De La Industria
Predeterminadas Para Un Uso Rápido Y Eficiente
Compatible con MAC / PC, completamente desbloqueado
No Se Necesita Experiencia; Fáciles De Seguir
Pathward Financial, Inc. (CASH) Bundle
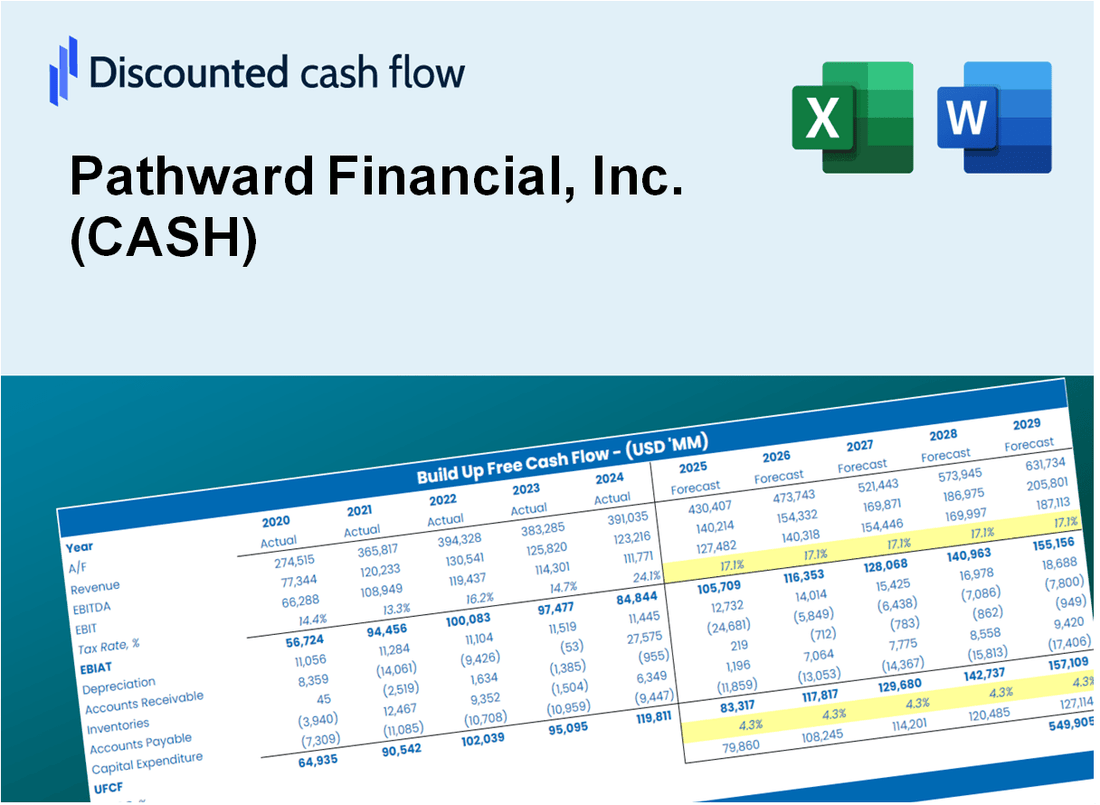
Diseñada para la precisión, nuestra calculadora DCF (en efectivo) le permite evaluar la valoración de Pathward Financial, Inc. utilizando datos financieros del mundo real, ofreciendo una flexibilidad completa para modificar todos los parámetros esenciales para mejorar las proyecciones.
Discounted Cash Flow (DCF) - (USD MM)
| Year | AY1 2020 |
AY2 2021 |
AY3 2022 |
AY4 2023 |
AY5 2024 |
FY1 2025 |
FY2 2026 |
FY3 2027 |
FY4 2028 |
FY5 2029 |
|---|---|---|---|---|---|---|---|---|---|---|
| Revenue | 477.0 | 515.1 | 501.3 | 588.3 | 626.2 | 671.7 | 720.6 | 773.0 | 829.3 | 889.6 |
| Revenue Growth, % | 0 | 7.99 | -2.69 | 17.35 | 6.45 | 7.27 | 7.27 | 7.27 | 7.27 | 7.27 |
| EBITDA | 175.8 | 215.5 | 248.9 | 247.1 | 256.6 | 283.9 | 304.5 | 326.7 | 350.5 | 375.9 |
| EBITDA, % | 36.84 | 41.83 | 49.66 | 42 | 40.97 | 42.26 | 42.26 | 42.26 | 42.26 | 42.26 |
| Depreciation | 60.7 | 59.0 | 61.6 | 65.0 | 57.8 | 76.2 | 81.8 | 87.7 | 94.1 | 101.0 |
| Depreciation, % | 12.73 | 11.46 | 12.29 | 11.04 | 9.22 | 11.35 | 11.35 | 11.35 | 11.35 | 11.35 |
| EBIT | 115.0 | 156.4 | 187.3 | 182.1 | 198.8 | 207.6 | 222.7 | 238.9 | 256.3 | 275.0 |
| EBIT, % | 24.11 | 30.37 | 37.37 | 30.96 | 31.75 | 30.91 | 30.91 | 30.91 | 30.91 | 30.91 |
| Total Cash | 1,241.9 | 2,178.9 | 2,270.9 | 2,179.8 | 1,899.6 | 671.7 | 720.6 | 773.0 | 829.3 | 889.6 |
| Total Cash, percent | .0 | .0 | .0 | .0 | .0 | .0 | .0 | .0 | .0 | .0 |
| Account Receivables | 16.6 | 282.3 | 228.7 | 206.7 | 183.6 | 226.2 | 242.6 | 260.3 | 279.2 | 299.5 |
| Account Receivables, % | 3.49 | 54.8 | 45.62 | 35.13 | 29.31 | 33.67 | 33.67 | 33.67 | 33.67 | 33.67 |
| Inventories | .0 | .0 | .0 | .0 | .0 | .0 | .0 | .0 | .0 | .0 |
| Inventories, % | 0 | 0 | 0 | 0 | 0 | 0 | 0 | 0 | 0 | 0 |
| Accounts Payable | 1.9 | .6 | .0 | .0 | .0 | .7 | .7 | .8 | .9 | .9 |
| Accounts Payable, % | 0.40311 | 0.1124 | 0 | 0 | 0 | 0.1031 | 0.1031 | 0.1031 | 0.1031 | 0.1031 |
| Capital Expenditure | -65.9 | -64.0 | -438.9 | -449.9 | -276.8 | -315.0 | -337.9 | -362.5 | -388.9 | -417.2 |
| Capital Expenditure, % | -13.82 | -12.43 | -87.55 | -76.48 | -44.2 | -46.89 | -46.89 | -46.89 | -46.89 | -46.89 |
| Tax Rate, % | 15.31 | 15.31 | 15.31 | 15.31 | 15.31 | 15.31 | 15.31 | 15.31 | 15.31 | 15.31 |
| EBITAT | 104.7 | 141.7 | 156.4 | 163.6 | 168.4 | 182.6 | 195.9 | 210.1 | 225.4 | 241.8 |
| Depreciation | ||||||||||
| Changes in Account Receivables | ||||||||||
| Changes in Inventories | ||||||||||
| Changes in Accounts Payable | ||||||||||
| Capital Expenditure | ||||||||||
| UFCF | 84.9 | -130.3 | -167.8 | -199.3 | -27.5 | -98.1 | -76.7 | -82.3 | -88.2 | -94.7 |
| WACC, % | 6.19 | 6.19 | 6.12 | 6.18 | 6.13 | 6.16 | 6.16 | 6.16 | 6.16 | 6.16 |
| PV UFCF | ||||||||||
| SUM PV UFCF | -368.9 | |||||||||
| Long Term Growth Rate, % | 2.00 | |||||||||
| Free cash flow (T + 1) | -97 | |||||||||
| Terminal Value | -2,320 | |||||||||
| Present Terminal Value | -1,720 | |||||||||
| Enterprise Value | -2,089 | |||||||||
| Net Debt | 252 | |||||||||
| Equity Value | -2,341 | |||||||||
| Diluted Shares Outstanding, MM | 25 | |||||||||
| Equity Value Per Share | -92.90 |
What You Will Get
- Authentic CASH Financial Data: Pre-filled with Pathward Financial’s historical and projected data for accurate analysis.
- Fully Customizable Template: Easily adjust key inputs such as revenue growth, WACC, and EBITDA %.
- Instant Calculations: Witness CASH’s intrinsic value update in real-time as you make changes.
- Professional Valuation Tool: Tailored for investors, analysts, and consultants aiming for precise DCF results.
- User-Friendly Interface: Intuitive layout and clear guidance suitable for all skill levels.
Key Features
- Comprehensive Financial Data: Pathward Financial’s historical financial statements and projected forecasts.
- Customizable Parameters: Adjust WACC, tax rates, revenue growth, and EBITDA margins as needed.
- Real-Time Valuation: Observe Pathward Financial’s intrinsic value update instantly.
- Visual Data Representation: Interactive dashboard charts illustrate valuation outcomes and essential metrics.
- Designed for Precision: A professional-grade tool tailored for analysts, investors, and finance professionals.
How It Works
- Step 1: Download the Excel file.
- Step 2: Review pre-entered Pathward Financial, Inc. (CASH) data (historical and projected).
- Step 3: Adjust key assumptions (yellow cells) based on your analysis.
- Step 4: View automatic recalculations for Pathward Financial, Inc. (CASH)'s intrinsic value.
- Step 5: Use the outputs for investment decisions or reporting.
Why Choose Pathward Financial's Calculator?
- All-in-One Solution: Combines DCF, WACC, and financial ratio analyses tailored for Pathward Financial, Inc. (CASH).
- Flexible Parameters: Modify highlighted cells to explore different financial scenarios.
- In-Depth Analysis: Automatically computes Pathward’s intrinsic value and Net Present Value.
- Preloaded Information: Access to historical and projected data for precise calculations.
- Expert-Level Tool: Perfect for financial analysts, investors, and business consultants focused on Pathward Financial, Inc. (CASH).
Who Should Use Pathward Financial, Inc. (CASH)?
- Investors: Gain insights for informed investment decisions with our comprehensive financial tools.
- Financial Analysts: Enhance your analysis with customizable models tailored to Pathward's performance.
- Consultants: Efficiently modify our resources for client meetings or strategic reports.
- Finance Enthusiasts: Explore the intricacies of financial services through detailed case studies and data.
- Educators and Students: Leverage our materials as a hands-on resource in finance education.
What the Template Contains
- Historical Data: Includes Pathward Financial’s past financials and baseline forecasts.
- DCF and Levered DCF Models: Detailed templates to calculate Pathward Financial’s intrinsic value.
- WACC Sheet: Pre-built calculations for Weighted Average Cost of Capital.
- Editable Inputs: Modify key drivers like growth rates, EBITDA %, and CAPEX assumptions.
- Quarterly and Annual Statements: A complete breakdown of Pathward Financial’s financials.
- Interactive Dashboard: Visualize valuation results and projections dynamically.
Disclaimer
All information, articles, and product details provided on this website are for general informational and educational purposes only. We do not claim any ownership over, nor do we intend to infringe upon, any trademarks, copyrights, logos, brand names, or other intellectual property mentioned or depicted on this site. Such intellectual property remains the property of its respective owners, and any references here are made solely for identification or informational purposes, without implying any affiliation, endorsement, or partnership.
We make no representations or warranties, express or implied, regarding the accuracy, completeness, or suitability of any content or products presented. Nothing on this website should be construed as legal, tax, investment, financial, medical, or other professional advice. In addition, no part of this site—including articles or product references—constitutes a solicitation, recommendation, endorsement, advertisement, or offer to buy or sell any securities, franchises, or other financial instruments, particularly in jurisdictions where such activity would be unlawful.
All content is of a general nature and may not address the specific circumstances of any individual or entity. It is not a substitute for professional advice or services. Any actions you take based on the information provided here are strictly at your own risk. You accept full responsibility for any decisions or outcomes arising from your use of this website and agree to release us from any liability in connection with your use of, or reliance upon, the content or products found herein.