
|
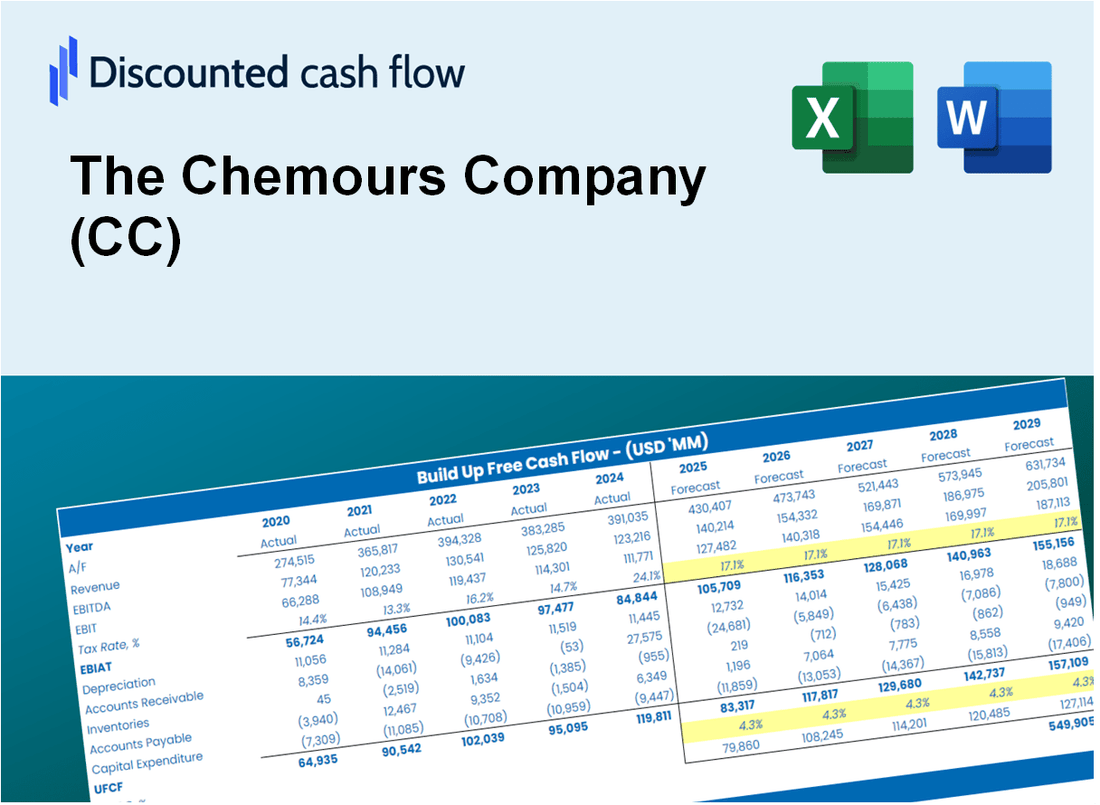
Valoración DCF de The Chemours Company (CC) |
Completamente Editable: Adáptelo A Sus Necesidades En Excel O Sheets
Diseño Profesional: Plantillas Confiables Y Estándares De La Industria
Predeterminadas Para Un Uso Rápido Y Eficiente
Compatible con MAC / PC, completamente desbloqueado
No Se Necesita Experiencia; Fáciles De Seguir
The Chemours Company (CC) Bundle
¡Descubra el verdadero valor de la compañía de Chemours con nuestra calculadora DCF avanzada! Ajuste los supuestos clave, explore diversos escenarios y evalúe cómo los cambios afectan la valoración de la compañía de quemados (CC), todo dentro de una plantilla de Excel fácil de usar.
What You Will Receive
- Customizable Excel Template: A fully editable Excel-based DCF Calculator featuring pre-filled real Chemours Company (CC) financials.
- Actual Market Data: Historical figures and projected estimates (highlighted in the yellow cells).
- Flexible Forecasting: Adjust forecast parameters such as revenue growth, EBITDA %, and WACC.
- Instant Calculations: Quickly observe how your inputs affect Chemours Company’s (CC) valuation.
- Professional Resource: Designed for investors, CFOs, consultants, and financial analysts.
- User-Centric Layout: Organized for clarity and ease of navigation, complete with step-by-step guidance.
Key Features
- Customizable Financial Inputs: Adjust essential parameters such as revenue projections, EBITDA margins, and capital investments.
- Instant DCF Valuation: Automatically computes intrinsic value, NPV, and additional financial metrics in real-time.
- High-Precision Accuracy: Leverages Chemours' actual financial data for reliable valuation results.
- Effortless Scenario Analysis: Evaluate various assumptions and analyze results with ease.
- Efficiency Booster: Remove the hassle of constructing intricate valuation models from the ground up.
How It Works
- Step 1: Download the prebuilt Excel template featuring The Chemours Company (CC) data.
- Step 2: Navigate through the pre-filled sheets to grasp the essential metrics.
- Step 3: Modify forecasts and assumptions in the editable yellow cells (WACC, growth, margins).
- Step 4: Instantly see recalculated results, including The Chemours Company (CC) intrinsic value.
- Step 5: Utilize the outputs to make informed investment decisions or create reports.
Why Choose Chemours (CC)?
- Innovative Solutions: Our cutting-edge products are designed to meet modern challenges.
- Sustainable Practices: Committed to environmental stewardship and responsible manufacturing.
- Expertise You Can Trust: Decades of experience in the chemical industry ensure reliability.
- Global Reach: Serving customers worldwide with a robust supply chain and support.
- Customer-Centric Approach: We prioritize your needs and work collaboratively to achieve success.
Who Should Use This Product?
- Individual Investors: Make informed decisions about buying or selling Chemours Company (CC) stock.
- Financial Analysts: Streamline valuation processes with ready-to-use financial models for Chemours Company (CC).
- Consultants: Deliver professional valuation insights on Chemours Company (CC) to clients quickly and accurately.
- Business Owners: Understand how companies like Chemours Company (CC) are valued to guide your own strategy.
- Finance Students: Learn valuation techniques using real-world data and scenarios related to Chemours Company (CC).
What the Template Contains
- Preloaded CC Data: Historical and projected financial data, including revenue, EBIT, and capital expenditures.
- DCF and WACC Models: Professional-grade sheets for calculating intrinsic value and Weighted Average Cost of Capital.
- Editable Inputs: Yellow-highlighted cells for adjusting revenue growth, tax rates, and discount rates.
- Financial Statements: Comprehensive annual and quarterly financials for deeper analysis.
- Key Ratios: Profitability, leverage, and efficiency ratios to evaluate performance.
- Dashboard and Charts: Visual summaries of valuation outcomes and assumptions.
Disclaimer
All information, articles, and product details provided on this website are for general informational and educational purposes only. We do not claim any ownership over, nor do we intend to infringe upon, any trademarks, copyrights, logos, brand names, or other intellectual property mentioned or depicted on this site. Such intellectual property remains the property of its respective owners, and any references here are made solely for identification or informational purposes, without implying any affiliation, endorsement, or partnership.
We make no representations or warranties, express or implied, regarding the accuracy, completeness, or suitability of any content or products presented. Nothing on this website should be construed as legal, tax, investment, financial, medical, or other professional advice. In addition, no part of this site—including articles or product references—constitutes a solicitation, recommendation, endorsement, advertisement, or offer to buy or sell any securities, franchises, or other financial instruments, particularly in jurisdictions where such activity would be unlawful.
All content is of a general nature and may not address the specific circumstances of any individual or entity. It is not a substitute for professional advice or services. Any actions you take based on the information provided here are strictly at your own risk. You accept full responsibility for any decisions or outcomes arising from your use of this website and agree to release us from any liability in connection with your use of, or reliance upon, the content or products found herein.