
|
Valoración DCF de CEA Industries Inc. (CEAD) |
Completamente Editable: Adáptelo A Sus Necesidades En Excel O Sheets
Diseño Profesional: Plantillas Confiables Y Estándares De La Industria
Predeterminadas Para Un Uso Rápido Y Eficiente
Compatible con MAC / PC, completamente desbloqueado
No Se Necesita Experiencia; Fáciles De Seguir
CEA Industries Inc. (CEAD) Bundle
¡Evalúe las perspectivas financieras de CEA Industries Inc. con experiencia! Esta calculadora DCF (CEAD) proporciona datos financieros previamente llenos y la flexibilidad para modificar el crecimiento de los ingresos, WACC, los márgenes y otros supuestos esenciales para alinearse con sus predicciones.
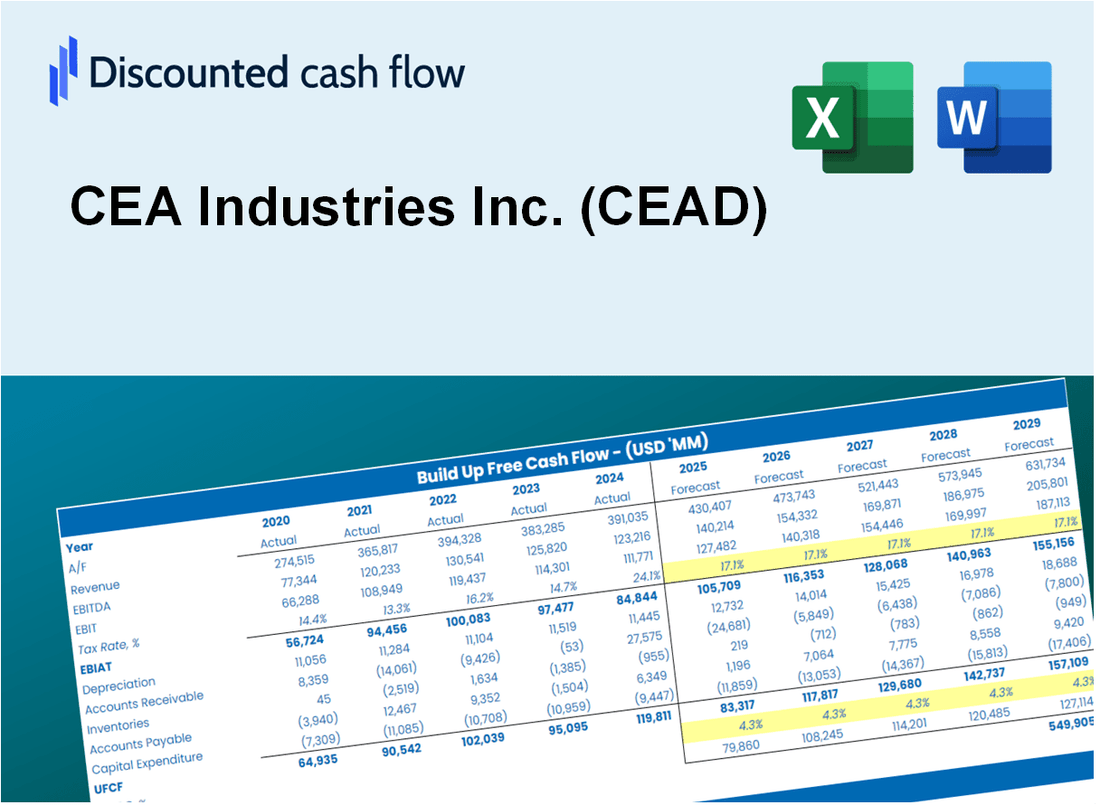
Discounted Cash Flow (DCF) - (USD MM)
| Year | AY1 2020 |
AY2 2021 |
AY3 2022 |
AY4 2023 |
AY5 2024 |
FY1 2025 |
FY2 2026 |
FY3 2027 |
FY4 2028 |
FY5 2029 |
|---|---|---|---|---|---|---|---|---|---|---|
| Revenue | 8.5 | 13.6 | 11.3 | 6.9 | 2.8 | 2.4 | 2.1 | 1.8 | 1.5 | 1.3 |
| Revenue Growth, % | 0 | 60.18 | -17.27 | -38.75 | -59.43 | -13.82 | -13.82 | -13.82 | -13.82 | -13.82 |
| EBITDA | -1.4 | -2.0 | -5.1 | -2.8 | -3.2 | -1.0 | -.9 | -.8 | -.7 | -.6 |
| EBITDA, % | -16.81 | -14.51 | -44.85 | -40.76 | -112.43 | -43.38 | -43.38 | -43.38 | -43.38 | -43.38 |
| Depreciation | .3 | .3 | .1 | .1 | .0 | .0 | .0 | .0 | .0 | .0 |
| Depreciation, % | 3.64 | 1.98 | 1.2 | 1.97 | 0.71572 | 1.9 | 1.9 | 1.9 | 1.9 | 1.9 |
| EBIT | -1.7 | -2.2 | -5.2 | -3.0 | -3.2 | -1.1 | -.9 | -.8 | -.7 | -.6 |
| EBIT, % | -20.45 | -16.49 | -46.05 | -42.73 | -113.15 | -45.14 | -45.14 | -45.14 | -45.14 | -45.14 |
| Total Cash | 2.3 | 2.2 | 18.6 | 12.5 | 9.5 | 1.7 | 1.4 | 1.2 | 1.1 | .9 |
| Total Cash, percent | .0 | .0 | .0 | .0 | .0 | .0 | .0 | .0 | .0 | .0 |
| Account Receivables | .0 | .2 | .0 | .2 | .2 | .1 | .1 | .1 | .0 | .0 |
| Account Receivables, % | 0.39322 | 1.32 | 0.02347741 | 3.52 | 8.82 | 2.81 | 2.81 | 2.81 | 2.81 | 2.81 |
| Inventories | .3 | .4 | .3 | .3 | .0 | .1 | .1 | .1 | .0 | .0 |
| Inventories, % | 3.84 | 2.77 | 3.09 | 4.37 | 0.92671 | 3 | 3 | 3 | 3 | 3 |
| Accounts Payable | .9 | .6 | .3 | .2 | .2 | .1 | .1 | .1 | .1 | .1 |
| Accounts Payable, % | 10.22 | 4.52 | 2.76 | 2.65 | 5.9 | 5.21 | 5.21 | 5.21 | 5.21 | 5.21 |
| Capital Expenditure | .0 | -.1 | .0 | .0 | .0 | .0 | .0 | .0 | .0 | .0 |
| Capital Expenditure, % | -0.1096 | -0.5034 | -0.26897 | 0 | 0 | -0.17639 | -0.17639 | -0.17639 | -0.17639 | -0.17639 |
| Tax Rate, % | 0 | 0 | 0 | 0 | 0 | 0 | 0 | 0 | 0 | 0 |
| EBITAT | -1.7 | -6.2 | -5.6 | -3.0 | -3.2 | -1.1 | -.9 | -.8 | -.7 | -.6 |
| Depreciation | ||||||||||
| Changes in Account Receivables | ||||||||||
| Changes in Inventories | ||||||||||
| Changes in Accounts Payable | ||||||||||
| Capital Expenditure | ||||||||||
| UFCF | -.9 | -6.4 | -5.6 | -3.1 | -2.9 | -1.0 | -.9 | -.8 | -.7 | -.6 |
| WACC, % | 6.53 | 6.53 | 6.53 | 6.53 | 6.53 | 6.53 | 6.53 | 6.53 | 6.53 | 6.53 |
| PV UFCF | ||||||||||
| SUM PV UFCF | -3.3 | |||||||||
| Long Term Growth Rate, % | 2.00 | |||||||||
| Free cash flow (T + 1) | -1 | |||||||||
| Terminal Value | -13 | |||||||||
| Present Terminal Value | -9 | |||||||||
| Enterprise Value | -13 | |||||||||
| Net Debt | -9 | |||||||||
| Equity Value | -4 | |||||||||
| Diluted Shares Outstanding, MM | 1 | |||||||||
| Equity Value Per Share | -4.81 |
What You Will Get
- Editable Forecast Inputs: Effortlessly modify assumptions (growth %, margins, WACC) to explore various scenarios.
- Real-World Data: CEA Industries Inc.'s (CEAD) financial data pre-loaded to facilitate your analysis.
- Automatic DCF Outputs: The template computes Net Present Value (NPV) and intrinsic value automatically.
- Customizable and Professional: A sleek Excel model that adjusts to meet your valuation requirements.
- Built for Analysts and Investors: Perfect for assessing projections, validating strategies, and optimizing time efficiency.
Key Features
- Comprehensive CEAD Data: Pre-filled with CEA Industries Inc.'s historical performance metrics and future projections.
- Customizable Assumptions: Modify revenue growth rates, profit margins, discount rates, tax implications, and capital investments.
- Adaptive Valuation Framework: Automatically refreshes Net Present Value (NPV) and intrinsic value according to your specified inputs.
- Multiple Scenario Analysis: Develop various forecasting scenarios to evaluate diverse valuation possibilities.
- Intuitive User Interface: Designed to be straightforward and accessible for both seasoned professionals and newcomers.
How It Works
- Download: Obtain the pre-configured Excel file featuring CEA Industries Inc.'s (CEAD) financial data.
- Customize: Modify projections, such as revenue growth, EBITDA %, and WACC.
- Update Automatically: The intrinsic value and NPV calculations refresh in real-time.
- Test Scenarios: Develop various forecasts and instantly compare results.
- Make Decisions: Leverage the valuation outcomes to inform your investment choices.
Why Choose CEA Industries Inc. (CEAD)?
- Streamlined Processes: No need to start from scratch – our tools are ready for immediate use.
- Enhanced Accuracy: Dependable data and calculations minimize valuation errors.
- Completely Customizable: Adjust the tools to suit your specific assumptions and forecasts.
- Simple to Understand: Intuitive charts and outputs facilitate easy analysis of results.
- Endorsed by Professionals: Crafted for experts who prioritize precision and functionality.
Who Should Use This Product?
- Professional Investors: Develop comprehensive and trustworthy valuation models for analyzing CEA Industries Inc. (CEAD) investments.
- Corporate Finance Teams: Evaluate valuation scenarios to inform strategic decisions within the organization.
- Consultants and Advisors: Deliver precise valuation insights to clients considering investments in CEA Industries Inc. (CEAD).
- Students and Educators: Utilize real-world data to enhance learning and practice in financial modeling.
- Industry Analysts: Gain insights into how companies like CEA Industries Inc. (CEAD) are valued in the marketplace.
What the Template Contains
- Comprehensive DCF Model: Editable template featuring detailed valuation calculations for CEA Industries Inc. (CEAD).
- Real-World Data: CEA Industries' historical and projected financials preloaded for thorough analysis.
- Customizable Parameters: Adjust WACC, growth rates, and tax assumptions to explore various scenarios.
- Financial Statements: Complete annual and quarterly breakdowns for enhanced insights into performance.
- Key Ratios: Integrated analysis for assessing profitability, efficiency, and leverage metrics.
- Dashboard with Visual Outputs: Interactive charts and tables for clear, actionable results.
Disclaimer
All information, articles, and product details provided on this website are for general informational and educational purposes only. We do not claim any ownership over, nor do we intend to infringe upon, any trademarks, copyrights, logos, brand names, or other intellectual property mentioned or depicted on this site. Such intellectual property remains the property of its respective owners, and any references here are made solely for identification or informational purposes, without implying any affiliation, endorsement, or partnership.
We make no representations or warranties, express or implied, regarding the accuracy, completeness, or suitability of any content or products presented. Nothing on this website should be construed as legal, tax, investment, financial, medical, or other professional advice. In addition, no part of this site—including articles or product references—constitutes a solicitation, recommendation, endorsement, advertisement, or offer to buy or sell any securities, franchises, or other financial instruments, particularly in jurisdictions where such activity would be unlawful.
All content is of a general nature and may not address the specific circumstances of any individual or entity. It is not a substitute for professional advice or services. Any actions you take based on the information provided here are strictly at your own risk. You accept full responsibility for any decisions or outcomes arising from your use of this website and agree to release us from any liability in connection with your use of, or reliance upon, the content or products found herein.