
|
Valoración DCF de Celularity Inc. (CELU) |
Completamente Editable: Adáptelo A Sus Necesidades En Excel O Sheets
Diseño Profesional: Plantillas Confiables Y Estándares De La Industria
Predeterminadas Para Un Uso Rápido Y Eficiente
Compatible con MAC / PC, completamente desbloqueado
No Se Necesita Experiencia; Fáciles De Seguir
Celularity Inc. (CELU) Bundle
¡Obtenga dominio sobre su análisis de valoración de Celularity Inc. (CELU) con nuestra calculadora DCF de vanguardia! Antes de datos reales de CELU, esta plantilla de Excel le permite ajustar los pronósticos y supuestos para calcular con precisión el valor intrínseco de Celularity Inc.
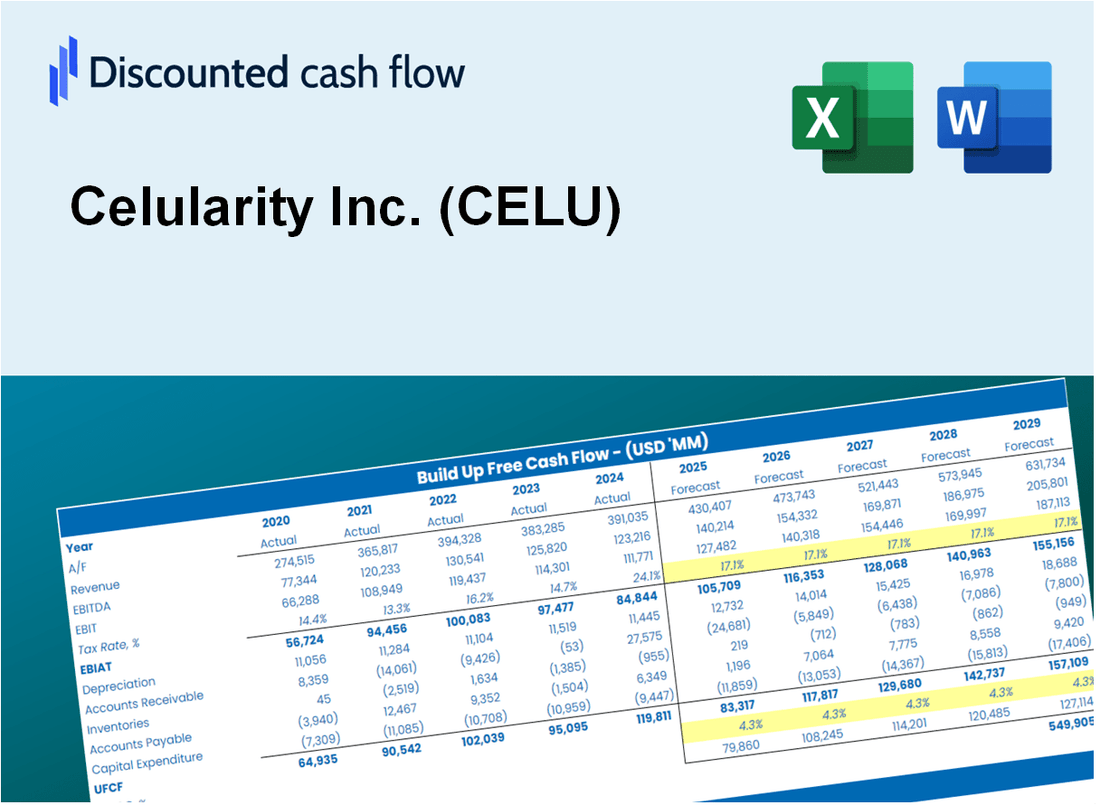
Discounted Cash Flow (DCF) - (USD MM)
| Year | AY1 2020 |
AY2 2021 |
AY3 2022 |
AY4 2023 |
AY5 2024 |
FY1 2025 |
FY2 2026 |
FY3 2027 |
FY4 2028 |
FY5 2029 |
|---|---|---|---|---|---|---|---|---|---|---|
| Revenue | 14.3 | 21.3 | 18.0 | 22.8 | 54.2 | 76.0 | 106.4 | 149.1 | 208.8 | 292.5 |
| Revenue Growth, % | 0 | 49.43 | -15.75 | 26.68 | 138.11 | 40.09 | 40.09 | 40.09 | 40.09 | 40.09 |
| EBITDA | -202.4 | -88.1 | 23.6 | -183.9 | -43.7 | -42.6 | -59.7 | -83.7 | -117.2 | -164.2 |
| EBITDA, % | -1417.6 | -412.98 | 131.19 | -807.81 | -80.61 | -56.12 | -56.12 | -56.12 | -56.12 | -56.12 |
| Depreciation | 8.2 | 8.8 | 9.4 | 9.3 | 7.9 | 31.3 | 43.9 | 61.5 | 86.2 | 120.7 |
| Depreciation, % | 57.25 | 41.33 | 52.17 | 40.95 | 14.61 | 41.26 | 41.26 | 41.26 | 41.26 | 41.26 |
| EBIT | -210.6 | -96.9 | 14.2 | -193.3 | -51.6 | -48.0 | -67.3 | -94.3 | -132.1 | -185.0 |
| EBIT, % | -1474.85 | -454.31 | 79.03 | -848.75 | -95.22 | -63.24 | -63.24 | -63.24 | -63.24 | -63.24 |
| Total Cash | 54.3 | 37.2 | 14.0 | .2 | .7 | 42.5 | 59.6 | 83.5 | 117.0 | 163.9 |
| Total Cash, percent | .0 | .0 | .0 | .0 | .0 | .0 | .0 | .0 | .0 | .0 |
| Account Receivables | 6.6 | 5.2 | 7.0 | 12.1 | 13.6 | 28.5 | 39.9 | 55.9 | 78.3 | 109.6 |
| Account Receivables, % | 45.87 | 24.53 | 38.75 | 53.22 | 25 | 37.48 | 37.48 | 37.48 | 37.48 | 37.48 |
| Inventories | 3.9 | 9.5 | 5.3 | 5.8 | 5.4 | 20.7 | 29.0 | 40.7 | 57.0 | 79.9 |
| Inventories, % | 26.96 | 44.76 | 29.53 | 25.26 | 9.98 | 27.3 | 27.3 | 27.3 | 27.3 | 27.3 |
| Accounts Payable | 5.4 | 9.3 | 5.8 | 14.1 | 23.3 | 33.2 | 46.6 | 65.2 | 91.4 | 128.0 |
| Accounts Payable, % | 37.75 | 43.67 | 32.32 | 62.11 | 42.97 | 43.76 | 43.76 | 43.76 | 43.76 | 43.76 |
| Capital Expenditure | -27.8 | -6.2 | -5.2 | -4.0 | -.2 | -26.8 | -37.5 | -52.6 | -73.6 | -103.1 |
| Capital Expenditure, % | -194.94 | -29.07 | -29.13 | -17.78 | -0.29694 | -35.26 | -35.26 | -35.26 | -35.26 | -35.26 |
| Tax Rate, % | 0 | 0 | 0 | 0 | 0 | 0 | 0 | 0 | 0 | 0 |
| EBITAT | -205.9 | -96.9 | 14.2 | -193.3 | -51.6 | -47.8 | -67.0 | -93.8 | -131.5 | -184.1 |
| Depreciation | ||||||||||
| Changes in Account Receivables | ||||||||||
| Changes in Inventories | ||||||||||
| Changes in Accounts Payable | ||||||||||
| Capital Expenditure | ||||||||||
| UFCF | -230.6 | -94.8 | 17.3 | -185.3 | -35.8 | -63.5 | -67.0 | -93.8 | -131.5 | -184.2 |
| WACC, % | 8.41 | 8.55 | 8.54 | 8.55 | 8.55 | 8.52 | 8.52 | 8.52 | 8.52 | 8.52 |
| PV UFCF | ||||||||||
| SUM PV UFCF | -406.0 | |||||||||
| Long Term Growth Rate, % | 2.00 | |||||||||
| Free cash flow (T + 1) | -188 | |||||||||
| Terminal Value | -2,882 | |||||||||
| Present Terminal Value | -1,915 | |||||||||
| Enterprise Value | -2,321 | |||||||||
| Net Debt | 68 | |||||||||
| Equity Value | -2,389 | |||||||||
| Diluted Shares Outstanding, MM | 22 | |||||||||
| Equity Value Per Share | -109.12 |
What You Will Get
- Real Celularity Data: Preloaded financials – from revenue to EBIT – based on actual and projected figures.
- Full Customization: Adjust all critical parameters (yellow cells) like WACC, growth %, and tax rates.
- Instant Valuation Updates: Automatic recalculations to analyze the impact of changes on Celularity’s fair value.
- Versatile Excel Template: Tailored for quick edits, scenario testing, and detailed projections.
- Time-Saving and Accurate: Skip building models from scratch while maintaining precision and flexibility.
Key Features
- Comprehensive Data: Celularity Inc.'s (CELU) detailed financial statements and projected forecasts.
- Customizable Parameters: Adjust WACC, tax rates, revenue growth, and EBITDA margins to suit your analysis.
- Real-Time Insights: Instantly view Celularity's (CELU) intrinsic value as it updates dynamically.
- Informative Visualizations: Interactive dashboard charts illustrate valuation outcomes and essential metrics.
- Designed for Precision: A reliable tool tailored for analysts, investors, and finance professionals.
How It Works
- Step 1: Download the Excel file.
- Step 2: Review pre-entered Celularity Inc. (CELU) data (historical and projected).
- Step 3: Adjust key assumptions (yellow cells) based on your analysis.
- Step 4: View automatic recalculations for Celularity Inc.'s intrinsic value.
- Step 5: Use the outputs for investment decisions or reporting.
Why Choose the Celularity Inc. (CELU) Calculator?
- Precision: Utilizes accurate Celularity financial data for reliable results.
- Adaptability: Built for users to easily experiment and adjust inputs as needed.
- Efficiency: Eliminate the complexities of creating a financial model from the ground up.
- Expert-Level: Crafted with the insight and usability expected by financial professionals.
- Intuitive: Designed for straightforward navigation, suitable for users without extensive financial modeling skills.
Who Should Use Celularity Inc. (CELU)?
- Investors: Enhance your portfolio decisions with insights from cutting-edge cellular therapies.
- Healthcare Analysts: Streamline your research with comprehensive data on innovative treatments.
- Consultants: Effortlessly modify presentations or reports to showcase the latest developments in cell-based medicine.
- Biotech Enthusiasts: Expand your knowledge of regenerative medicine through real-world applications and case studies.
- Educators and Students: Utilize it as a valuable resource in courses focused on biotechnology and healthcare innovation.
What the Template Contains
- Operating and Balance Sheet Data: Pre-filled Celularity Inc. (CELU) historical data and forecasts, including revenue, EBITDA, EBIT, and capital expenditures.
- WACC Calculation: A dedicated sheet for Weighted Average Cost of Capital (WACC), including parameters like Beta, risk-free rate, and share price.
- DCF Valuation (Unlevered and Levered): Editable Discounted Cash Flow models showing intrinsic value with detailed calculations.
- Financial Statements: Pre-loaded financial statements (annual and quarterly) to support analysis.
- Key Ratios: Includes profitability, leverage, and efficiency ratios for Celularity Inc. (CELU).
- Dashboard and Charts: Visual summary of valuation outputs and assumptions to analyze results easily.
Disclaimer
All information, articles, and product details provided on this website are for general informational and educational purposes only. We do not claim any ownership over, nor do we intend to infringe upon, any trademarks, copyrights, logos, brand names, or other intellectual property mentioned or depicted on this site. Such intellectual property remains the property of its respective owners, and any references here are made solely for identification or informational purposes, without implying any affiliation, endorsement, or partnership.
We make no representations or warranties, express or implied, regarding the accuracy, completeness, or suitability of any content or products presented. Nothing on this website should be construed as legal, tax, investment, financial, medical, or other professional advice. In addition, no part of this site—including articles or product references—constitutes a solicitation, recommendation, endorsement, advertisement, or offer to buy or sell any securities, franchises, or other financial instruments, particularly in jurisdictions where such activity would be unlawful.
All content is of a general nature and may not address the specific circumstances of any individual or entity. It is not a substitute for professional advice or services. Any actions you take based on the information provided here are strictly at your own risk. You accept full responsibility for any decisions or outcomes arising from your use of this website and agree to release us from any liability in connection with your use of, or reliance upon, the content or products found herein.