
|
Valoración DCF de CF Industries Holdings, Inc. (CF) |
Completamente Editable: Adáptelo A Sus Necesidades En Excel O Sheets
Diseño Profesional: Plantillas Confiables Y Estándares De La Industria
Predeterminadas Para Un Uso Rápido Y Eficiente
Compatible con MAC / PC, completamente desbloqueado
No Se Necesita Experiencia; Fáciles De Seguir
CF Industries Holdings, Inc. (CF) Bundle
¡Descubra el verdadero potencial de CF Industries Holdings, Inc. (CF) con nuestra calculadora DCF avanzada! Ajuste los supuestos clave, explore varios escenarios y evalúe cómo los cambios afectan la valoración de la FQ, todo dentro de una plantilla de Excel fácil de usar.
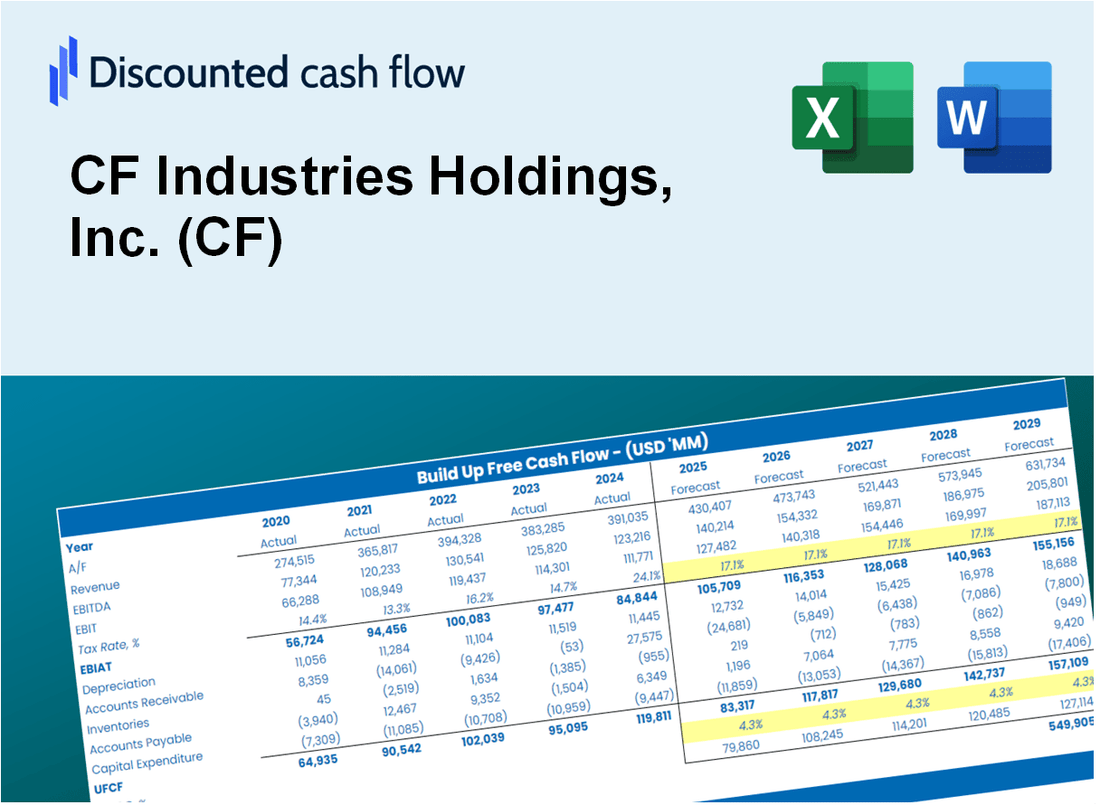
Discounted Cash Flow (DCF) - (USD MM)
| Year | AY1 2020 |
AY2 2021 |
AY3 2022 |
AY4 2023 |
AY5 2024 |
FY1 2025 |
FY2 2026 |
FY3 2027 |
FY4 2028 |
FY5 2029 |
|---|---|---|---|---|---|---|---|---|---|---|
| Revenue | 4,124.0 | 6,538.0 | 11,186.0 | 6,631.0 | 5,936.0 | 7,099.8 | 8,491.9 | 10,156.8 | 12,148.2 | 14,530.1 |
| Revenue Growth, % | 0 | 58.54 | 71.09 | -40.72 | -10.48 | 19.61 | 19.61 | 19.61 | 19.61 | 19.61 |
| EBITDA | 1,526.0 | 2,606.0 | 6,280.0 | 3,267.0 | 2,826.0 | 3,264.2 | 3,904.2 | 4,669.7 | 5,585.3 | 6,680.3 |
| EBITDA, % | 37 | 39.86 | 56.14 | 49.27 | 47.61 | 45.98 | 45.98 | 45.98 | 45.98 | 45.98 |
| Depreciation | 884.0 | 879.0 | 841.0 | 869.0 | 925.0 | 1,009.4 | 1,207.3 | 1,444.0 | 1,727.1 | 2,065.8 |
| Depreciation, % | 21.44 | 13.44 | 7.52 | 13.11 | 15.58 | 14.22 | 14.22 | 14.22 | 14.22 | 14.22 |
| EBIT | 642.0 | 1,727.0 | 5,439.0 | 2,398.0 | 1,901.0 | 2,254.8 | 2,696.9 | 3,225.7 | 3,858.1 | 4,614.6 |
| EBIT, % | 15.57 | 26.41 | 48.62 | 36.16 | 32.02 | 31.76 | 31.76 | 31.76 | 31.76 | 31.76 |
| Total Cash | 683.0 | 1,628.0 | 2,323.0 | 2,032.0 | 1,614.0 | 1,704.9 | 2,039.1 | 2,438.9 | 2,917.1 | 3,489.0 |
| Total Cash, percent | .0 | .0 | .0 | .0 | .0 | .0 | .0 | .0 | .0 | .0 |
| Account Receivables | 265.0 | 497.0 | 582.0 | 505.0 | 404.0 | 477.8 | 571.5 | 683.6 | 817.6 | 977.9 |
| Account Receivables, % | 6.43 | 7.6 | 5.2 | 7.62 | 6.81 | 6.73 | 6.73 | 6.73 | 6.73 | 6.73 |
| Inventories | 287.0 | 408.0 | 474.0 | 299.0 | 314.0 | 386.7 | 462.6 | 553.3 | 661.7 | 791.5 |
| Inventories, % | 6.96 | 6.24 | 4.24 | 4.51 | 5.29 | 5.45 | 5.45 | 5.45 | 5.45 | 5.45 |
| Accounts Payable | 85.0 | 110.0 | 63.0 | 114.0 | 125.0 | 115.5 | 138.1 | 165.2 | 197.6 | 236.3 |
| Accounts Payable, % | 2.06 | 1.68 | 0.5632 | 1.72 | 2.11 | 1.63 | 1.63 | 1.63 | 1.63 | 1.63 |
| Capital Expenditure | -309.0 | -524.0 | -462.0 | -501.0 | -518.0 | -510.0 | -610.0 | -729.7 | -872.7 | -1,043.8 |
| Capital Expenditure, % | -7.49 | -8.01 | -4.13 | -7.56 | -8.73 | -7.18 | -7.18 | -7.18 | -7.18 | -7.18 |
| Tax Rate, % | 30.87 | 30.87 | 30.87 | 30.87 | 30.87 | 30.87 | 30.87 | 30.87 | 30.87 | 30.87 |
| EBITAT | 439.6 | 1,026.4 | 3,571.9 | 1,626.8 | 1,314.1 | 1,490.6 | 1,782.8 | 2,132.4 | 2,550.5 | 3,050.5 |
| Depreciation | ||||||||||
| Changes in Account Receivables | ||||||||||
| Changes in Inventories | ||||||||||
| Changes in Accounts Payable | ||||||||||
| Capital Expenditure | ||||||||||
| UFCF | 547.6 | 1,053.4 | 3,752.9 | 2,297.8 | 1,818.1 | 1,833.8 | 2,233.2 | 2,671.1 | 3,194.8 | 3,821.2 |
| WACC, % | 6.16 | 6.1 | 6.14 | 6.15 | 6.16 | 6.14 | 6.14 | 6.14 | 6.14 | 6.14 |
| PV UFCF | ||||||||||
| SUM PV UFCF | 11,297.2 | |||||||||
| Long Term Growth Rate, % | 0.50 | |||||||||
| Free cash flow (T + 1) | 3,840 | |||||||||
| Terminal Value | 68,072 | |||||||||
| Present Terminal Value | 50,529 | |||||||||
| Enterprise Value | 61,826 | |||||||||
| Net Debt | 1,632 | |||||||||
| Equity Value | 60,194 | |||||||||
| Diluted Shares Outstanding, MM | 181 | |||||||||
| Equity Value Per Share | 333.12 |
What You Will Get
- Pre-Filled Financial Model: CF Industries’ actual data allows for accurate DCF valuation.
- Full Forecast Control: Modify revenue growth, margins, WACC, and other essential drivers.
- Instant Calculations: Automatic updates provide real-time results as you adjust inputs.
- Investor-Ready Template: A polished Excel file crafted for high-quality valuation.
- Customizable and Reusable: Designed for adaptability, enabling repeated use for comprehensive forecasts.
Key Features
- Pre-Loaded Data: CF Industries' historical financial statements and pre-filled forecasts.
- Fully Adjustable Inputs: Modify WACC, tax rates, revenue growth, and EBITDA margins.
- Instant Results: Watch CF Industries' intrinsic value recalculate in real time.
- Clear Visual Outputs: Dashboard charts present valuation results and key metrics.
- Built for Accuracy: A professional tool designed for analysts, investors, and finance experts.
How It Works
- 1. Access the Template: Download and open the Excel file containing CF Industries Holdings, Inc. (CF) preloaded data.
- 2. Adjust Assumptions: Modify essential inputs such as growth rates, WACC, and capital expenditures.
- 3. View Results Instantly: The DCF model automatically computes intrinsic value and NPV.
- 4. Explore Scenarios: Analyze various forecasts to evaluate different valuation results.
- 5. Present with Assurance: Deliver professional valuation insights to enhance your decision-making process.
Why Choose This Calculator for CF Industries Holdings, Inc. (CF)?
- User-Friendly Interface: Perfect for both novices and seasoned professionals.
- Customizable Inputs: Adjust parameters effortlessly to suit your financial analysis.
- Real-Time Valuation: Instantly observe changes to CF's valuation as you tweak inputs.
- Preloaded Data: Comes equipped with CF's actual financial figures for immediate evaluation.
- Preferred by Experts: Widely utilized by investors and analysts for strategic decision-making.
Who Should Use This Product?
- Investors: Accurately estimate CF Industries Holdings, Inc.'s (CF) fair value before making investment decisions.
- CFOs: Leverage a professional-grade DCF model for financial reporting and analysis of CF Industries.
- Consultants: Quickly adapt the template for valuation reports tailored to CF Industries for clients.
- Entrepreneurs: Gain insights into financial modeling practices used by leading companies in the agricultural sector.
- Educators: Use it as a teaching tool to demonstrate valuation methodologies specific to the fertilizer industry.
What the Template Contains
- Operating and Balance Sheet Data: Pre-filled CF Industries Holdings, Inc. (CF) historical data and forecasts, including revenue, EBITDA, EBIT, and capital expenditures.
- WACC Calculation: A dedicated sheet for Weighted Average Cost of Capital (WACC), including parameters like Beta, risk-free rate, and share price.
- DCF Valuation (Unlevered and Levered): Editable Discounted Cash Flow models showing intrinsic value with detailed calculations.
- Financial Statements: Pre-loaded financial statements (annual and quarterly) to support analysis.
- Key Ratios: Includes profitability, leverage, and efficiency ratios for CF Industries Holdings, Inc. (CF).
- Dashboard and Charts: Visual summary of valuation outputs and assumptions to analyze results easily.
Disclaimer
All information, articles, and product details provided on this website are for general informational and educational purposes only. We do not claim any ownership over, nor do we intend to infringe upon, any trademarks, copyrights, logos, brand names, or other intellectual property mentioned or depicted on this site. Such intellectual property remains the property of its respective owners, and any references here are made solely for identification or informational purposes, without implying any affiliation, endorsement, or partnership.
We make no representations or warranties, express or implied, regarding the accuracy, completeness, or suitability of any content or products presented. Nothing on this website should be construed as legal, tax, investment, financial, medical, or other professional advice. In addition, no part of this site—including articles or product references—constitutes a solicitation, recommendation, endorsement, advertisement, or offer to buy or sell any securities, franchises, or other financial instruments, particularly in jurisdictions where such activity would be unlawful.
All content is of a general nature and may not address the specific circumstances of any individual or entity. It is not a substitute for professional advice or services. Any actions you take based on the information provided here are strictly at your own risk. You accept full responsibility for any decisions or outcomes arising from your use of this website and agree to release us from any liability in connection with your use of, or reliance upon, the content or products found herein.