
|
Centerra Gold Inc. (CGAU) DCF Valoración |
Completamente Editable: Adáptelo A Sus Necesidades En Excel O Sheets
Diseño Profesional: Plantillas Confiables Y Estándares De La Industria
Predeterminadas Para Un Uso Rápido Y Eficiente
Compatible con MAC / PC, completamente desbloqueado
No Se Necesita Experiencia; Fáciles De Seguir
Centerra Gold Inc. (CGAU) Bundle
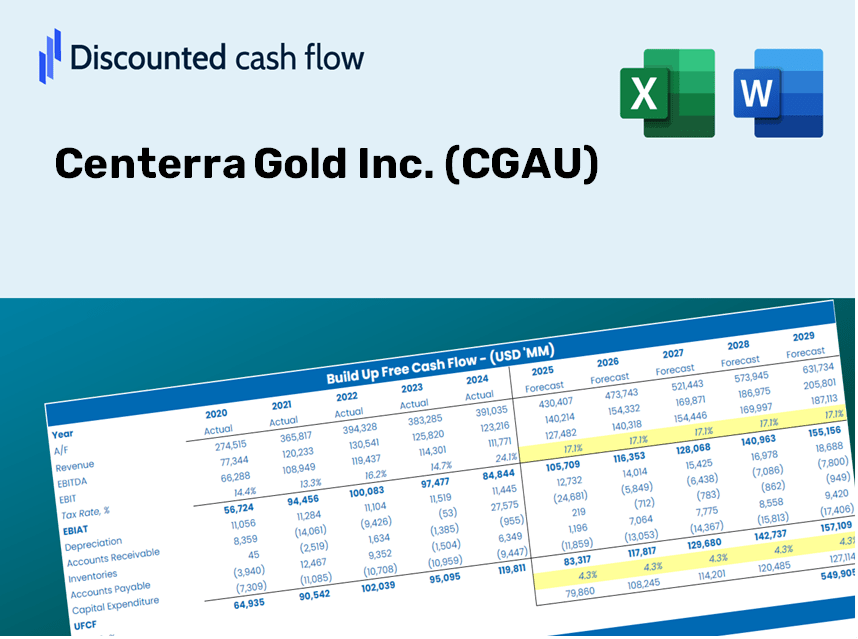
¿Buscas evaluar el valor intrínseco de Centerra Gold Inc.? Nuestra calculadora CGAU DCF integra datos del mundo real con extensas características de personalización, lo que le permite ajustar los pronósticos y mejorar sus opciones de inversión.
Discounted Cash Flow (DCF) - (USD MM)
| Year | AY1 2020 |
AY2 2021 |
AY3 2022 |
AY4 2023 |
AY5 2024 |
FY1 2025 |
FY2 2026 |
FY3 2027 |
FY4 2028 |
FY5 2029 |
|---|---|---|---|---|---|---|---|---|---|---|
| Revenue | 1,688.7 | 900.1 | 850.2 | 1,094.9 | 1,214.5 | 1,176.4 | 1,139.6 | 1,103.8 | 1,069.2 | 1,035.7 |
| Revenue Growth, % | 0 | -46.7 | -5.55 | 28.78 | 10.92 | -3.13 | -3.13 | -3.13 | -3.13 | -3.13 |
| EBITDA | 203.3 | 552.5 | 65.8 | 144.0 | 393.1 | 298.1 | 288.7 | 279.7 | 270.9 | 262.4 |
| EBITDA, % | 12.04 | 61.38 | 7.74 | 13.15 | 32.37 | 25.34 | 25.34 | 25.34 | 25.34 | 25.34 |
| Depreciation | 166.0 | 150.0 | 104.7 | 129.7 | 321.2 | 181.4 | 175.7 | 170.2 | 164.9 | 159.7 |
| Depreciation, % | 9.83 | 16.67 | 12.32 | 11.85 | 26.44 | 15.42 | 15.42 | 15.42 | 15.42 | 15.42 |
| EBIT | 37.3 | 402.5 | -38.9 | 14.3 | 71.9 | 116.6 | 113.0 | 109.4 | 106.0 | 102.7 |
| EBIT, % | 2.21 | 44.71 | -4.58 | 1.31 | 5.92 | 9.91 | 9.91 | 9.91 | 9.91 | 9.91 |
| Total Cash | 548.7 | 949.4 | 531.9 | 615.8 | 628.4 | 713.0 | 690.7 | 669.0 | 648.0 | 627.7 |
| Total Cash, percent | .0 | .0 | .0 | .0 | .0 | .0 | .0 | .0 | .0 | .0 |
| Account Receivables | 66.1 | 76.8 | 117.2 | 70.8 | 75.0 | 91.5 | 88.6 | 85.8 | 83.1 | 80.5 |
| Account Receivables, % | 3.91 | 8.54 | 13.78 | 6.46 | 6.18 | 7.77 | 7.77 | 7.77 | 7.77 | 7.77 |
| Inventories | 580.6 | 221.2 | 316.8 | 257.3 | 234.2 | 327.1 | 316.8 | 306.9 | 297.3 | 287.9 |
| Inventories, % | 34.38 | 24.58 | 37.26 | 23.5 | 19.29 | 27.8 | 27.8 | 27.8 | 27.8 | 27.8 |
| Accounts Payable | 113.5 | 67.0 | 111.2 | 77.9 | 79.6 | 96.3 | 93.2 | 90.3 | 87.5 | 84.8 |
| Accounts Payable, % | 6.72 | 7.44 | 13.08 | 7.11 | 6.55 | 8.18 | 8.18 | 8.18 | 8.18 | 8.18 |
| Capital Expenditure | -326.2 | -92.5 | -80.9 | -85.3 | -184.3 | -146.1 | -141.5 | -137.1 | -132.8 | -128.6 |
| Capital Expenditure, % | -19.32 | -10.28 | -9.52 | -7.79 | -15.17 | -12.42 | -12.42 | -12.42 | -12.42 | -12.42 |
| Tax Rate, % | 53.81 | 53.81 | 53.81 | 53.81 | 53.81 | 53.81 | 53.81 | 53.81 | 53.81 | 53.81 |
| EBITAT | 36.6 | 446.5 | -67.6 | -86.8 | 33.2 | 80.3 | 77.8 | 75.4 | 73.0 | 70.7 |
| Depreciation | ||||||||||
| Changes in Account Receivables | ||||||||||
| Changes in Inventories | ||||||||||
| Changes in Accounts Payable | ||||||||||
| Capital Expenditure | ||||||||||
| UFCF | -656.8 | 806.1 | -135.5 | 30.2 | 190.6 | 23.1 | 122.1 | 118.3 | 114.6 | 111.0 |
| WACC, % | 9.62 | 9.62 | 9.62 | 9.45 | 9.53 | 9.57 | 9.57 | 9.57 | 9.57 | 9.57 |
| PV UFCF | ||||||||||
| SUM PV UFCF | 362.6 | |||||||||
| Long Term Growth Rate, % | 2.00 | |||||||||
| Free cash flow (T + 1) | 113 | |||||||||
| Terminal Value | 1,496 | |||||||||
| Present Terminal Value | 947 | |||||||||
| Enterprise Value | 1,310 | |||||||||
| Net Debt | -605 | |||||||||
| Equity Value | 1,915 | |||||||||
| Diluted Shares Outstanding, MM | 216 | |||||||||
| Equity Value Per Share | 8.85 |
What You Will Receive
- Authentic CGAU Financial Data: Pre-loaded with Centerra Gold's historical and forecasted figures for in-depth analysis.
- Fully Customizable Template: Easily adjust key parameters such as revenue growth, WACC, and EBITDA percentage.
- Instant Calculations: Witness real-time updates to Centerra Gold's intrinsic value as you tweak your inputs.
- Expert Valuation Tool: Tailored for investors, analysts, and consultants who require reliable DCF outcomes.
- Intuitive Design: Streamlined layout and straightforward guidance suitable for all levels of expertise.
Highlighted Features
- Comprehensive DCF Calculator: Offers detailed unlevered and levered DCF valuation frameworks.
- WACC Tool: Features a pre-configured Weighted Average Cost of Capital worksheet with adjustable parameters.
- Customizable Forecast Assumptions: Easily adjust growth projections, capital expenditures, and discount rates.
- Integrated Financial Ratios: Evaluate profitability, leverage, and efficiency ratios specifically for Centerra Gold Inc. (CGAU).
- Interactive Dashboard and Charts: Visual representations summarize essential valuation metrics for straightforward analysis.
How It Functions
- Download: Obtain the pre-configured Excel file featuring Centerra Gold Inc.'s (CGAU) financial data.
- Customize: Modify projections, including revenue growth, EBITDA %, and WACC.
- Update Automatically: Experience real-time updates for intrinsic value and NPV calculations.
- Test Scenarios: Develop various forecasts and instantly compare results.
- Make Decisions: Leverage the valuation insights to inform your investment choices.
Why Choose This Calculator for Centerra Gold Inc. (CGAU)?
- Precise Insights: Utilize real financial data from Centerra Gold for trustworthy valuation outcomes.
- Flexible Options: Tailor essential variables such as growth projections, WACC, and tax rates to align with your assumptions.
- Efficient: Pre-configured calculations save time by removing the need to build models from the ground up.
- Expert Quality Tool: Crafted for investors, analysts, and consultants in the mining sector.
- Easy to Navigate: User-friendly design and straightforward instructions make it accessible for everyone.
Who Should Utilize This Product?
- Professional Investors: Create accurate and comprehensive valuation models for portfolio assessments related to Centerra Gold Inc. (CGAU).
- Corporate Finance Teams: Evaluate valuation scenarios to inform and shape internal business strategies for Centerra Gold Inc. (CGAU).
- Consultants and Advisors: Equip clients with precise valuation insights concerning Centerra Gold Inc. (CGAU) stock.
- Students and Educators: Leverage real-world data to practice and teach financial modeling with respect to Centerra Gold Inc. (CGAU).
- Mining Industry Enthusiasts: Gain insights into how companies like Centerra Gold Inc. (CGAU) are appraised in the market.
Contents of the Template
- Pre-Filled DCF Model: Centerra Gold Inc.'s (CGAU) financial data loaded for instant application.
- WACC Calculator: Comprehensive calculations for Weighted Average Cost of Capital.
- Financial Ratios: Assess Centerra Gold Inc.'s (CGAU) profitability, leverage, and operational efficiency.
- Editable Inputs: Modify assumptions like growth rates, profit margins, and CAPEX to tailor them to your needs.
- Financial Statements: Access to annual and quarterly reports for thorough analysis.
- Interactive Dashboard: Easily visualize critical valuation metrics and outcomes.
Disclaimer
All information, articles, and product details provided on this website are for general informational and educational purposes only. We do not claim any ownership over, nor do we intend to infringe upon, any trademarks, copyrights, logos, brand names, or other intellectual property mentioned or depicted on this site. Such intellectual property remains the property of its respective owners, and any references here are made solely for identification or informational purposes, without implying any affiliation, endorsement, or partnership.
We make no representations or warranties, express or implied, regarding the accuracy, completeness, or suitability of any content or products presented. Nothing on this website should be construed as legal, tax, investment, financial, medical, or other professional advice. In addition, no part of this site—including articles or product references—constitutes a solicitation, recommendation, endorsement, advertisement, or offer to buy or sell any securities, franchises, or other financial instruments, particularly in jurisdictions where such activity would be unlawful.
All content is of a general nature and may not address the specific circumstances of any individual or entity. It is not a substitute for professional advice or services. Any actions you take based on the information provided here are strictly at your own risk. You accept full responsibility for any decisions or outcomes arising from your use of this website and agree to release us from any liability in connection with your use of, or reliance upon, the content or products found herein.