
|
CG Power and Industrial Solutions Limited (CGPower.NS) Valoración de DCF |
Completamente Editable: Adáptelo A Sus Necesidades En Excel O Sheets
Diseño Profesional: Plantillas Confiables Y Estándares De La Industria
Predeterminadas Para Un Uso Rápido Y Eficiente
Compatible con MAC / PC, completamente desbloqueado
No Se Necesita Experiencia; Fáciles De Seguir
CG Power and Industrial Solutions Limited (CGPOWER.NS) Bundle
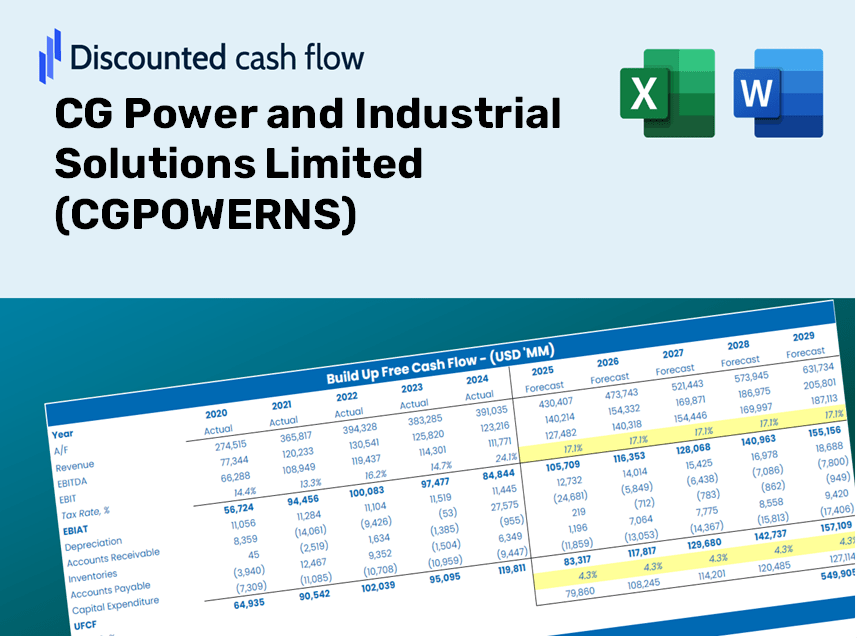
Ya sea que sea un inversor o analista, esta calculadora DCF (CGPowerns) es su recurso de referencia para una valoración precisa. Precedidos con datos reales de CG Power and Industrial Solutions Limited, puede ajustar previsiones y observar los efectos en tiempo real.
What You Will Receive
- Customizable Excel Template: An entirely adjustable Excel-based DCF Calculator featuring pre-loaded financial data for CG Power and Industrial Solutions Limited (CGPOWERNS).
- Current Data: Access to historical figures and forward-looking projections (highlighted in the yellow cells).
- Flexibility in Forecasting: Modify assumptions regarding revenue growth, EBITDA margins, and WACC.
- Instant Calculations: Quickly assess how your inputs affect the valuation of CG Power and Industrial Solutions Limited (CGPOWERNS).
- Professional-Grade Tool: Designed for investors, CFOs, consultants, and financial analysts.
- Intuitive Design: Organized for clarity and ease of navigation, complete with step-by-step guidance.
Key Features
- Authentic CGPOWERNS Data: Pre-filled with CG Power's historical performance metrics and future projections.
- Completely Customizable Inputs: Modify revenue growth rates, profit margins, discount rates, tax considerations, and capital expenditures.
- Interactive Valuation Model: Automatic updates to Net Present Value (NPV) and intrinsic value based on your selections.
- Scenario Analysis: Develop various forecast scenarios to evaluate different valuation outcomes.
- Intuitive User Experience: Designed for ease of use, suitable for both experts and newcomers.
How It Works
- Step 1: Download the Excel file for CG Power and Industrial Solutions Limited (CGPOWERNS).
- Step 2: Review the pre-filled financial data and forecasts specific to CGPOWERNS.
- Step 3: Adjust key inputs such as revenue growth, WACC, and tax rates (highlighted cells).
- Step 4: Observe the DCF model update in real-time as you modify your assumptions.
- Step 5: Evaluate the outputs to inform your investment decisions regarding CGPOWERNS.
Why Opt for This Calculator?
- Precision: Utilizes accurate financial data from CG Power and Industrial Solutions Limited (CGPOWERNS).
- Versatility: Crafted to allow users to easily adjust and experiment with various inputs.
- Efficiency: Eliminate the need to construct a DCF model from the ground up.
- Professional Quality: Engineered with the expertise and usability akin to CFO standards.
- User-Friendly: Intuitive design makes it accessible to users lacking advanced financial modeling skills.
Who Should Consider Using This Product?
- Investors: Evaluate CG Power and Industrial Solutions Limited's (CGPOWERNS) valuation prior to making stock transactions.
- CFOs and Financial Analysts: Optimize valuation processes and assess financial projections.
- Startup Founders: Understand the valuation methods applied to large public companies like CG Power.
- Consultants: Create detailed valuation reports for your clients based on CG Power's performance.
- Students and Educators: Utilize real market data to teach and practice valuation strategies.
Contents of the Template
- Pre-Filled DCF Model: CG Power and Industrial Solutions Limited’s financial data preloaded for immediate analysis.
- WACC Calculator: Comprehensive calculations for the Weighted Average Cost of Capital.
- Financial Ratios: Assess CG Power's profitability, leverage, and operational efficiency.
- Editable Inputs: Adjust assumptions like growth rates, margins, and capital expenditures to suit your scenarios.
- Financial Statements: Access annual and quarterly reports for thorough financial examination.
- Interactive Dashboard: Effortlessly visualize critical valuation metrics and outcomes.
Disclaimer
All information, articles, and product details provided on this website are for general informational and educational purposes only. We do not claim any ownership over, nor do we intend to infringe upon, any trademarks, copyrights, logos, brand names, or other intellectual property mentioned or depicted on this site. Such intellectual property remains the property of its respective owners, and any references here are made solely for identification or informational purposes, without implying any affiliation, endorsement, or partnership.
We make no representations or warranties, express or implied, regarding the accuracy, completeness, or suitability of any content or products presented. Nothing on this website should be construed as legal, tax, investment, financial, medical, or other professional advice. In addition, no part of this site—including articles or product references—constitutes a solicitation, recommendation, endorsement, advertisement, or offer to buy or sell any securities, franchises, or other financial instruments, particularly in jurisdictions where such activity would be unlawful.
All content is of a general nature and may not address the specific circumstances of any individual or entity. It is not a substitute for professional advice or services. Any actions you take based on the information provided here are strictly at your own risk. You accept full responsibility for any decisions or outcomes arising from your use of this website and agree to release us from any liability in connection with your use of, or reliance upon, the content or products found herein.