
|
Valoración DCF de Cognition Therapeutics, Inc. (CGTX) |
Completamente Editable: Adáptelo A Sus Necesidades En Excel O Sheets
Diseño Profesional: Plantillas Confiables Y Estándares De La Industria
Predeterminadas Para Un Uso Rápido Y Eficiente
Compatible con MAC / PC, completamente desbloqueado
No Se Necesita Experiencia; Fáciles De Seguir
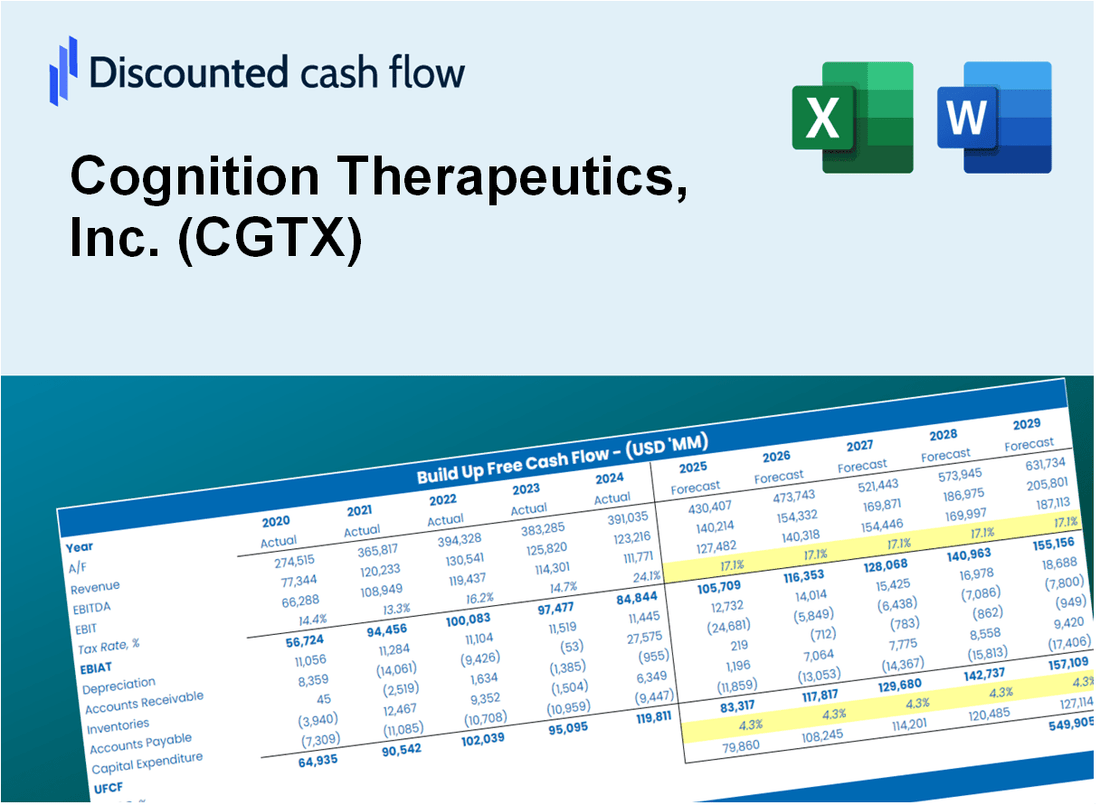
Cognition Therapeutics, Inc. (CGTX) Bundle
¡Mejore sus opciones de inversión con la calculadora DCF de Cognition Therapeutics, Inc. (CGTX)! Explore los datos financieros reales para la terapéutica de cognición, ajuste las proyecciones y gastos de crecimiento, y observe instantáneamente cómo las modificaciones afectan el valor intrínseco de CGTX.
Discounted Cash Flow (DCF) - (USD MM)
| Year | AY1 2020 |
AY2 2021 |
AY3 2022 |
AY4 2023 |
AY5 2024 |
FY1 2025 |
FY2 2026 |
FY3 2027 |
FY4 2028 |
FY5 2029 |
|---|---|---|---|---|---|---|---|---|---|---|
| Revenue | .0 | .0 | .0 | .0 | .0 | .0 | .0 | .0 | .0 | .0 |
| Revenue Growth, % | 0 | 0 | 0 | 0 | 0 | 0 | 0 | 0 | 0 | 0 |
| EBITDA | -6.0 | -10.7 | -21.1 | -25.5 | -33.7 | .0 | .0 | .0 | .0 | .0 |
| EBITDA, % | 100 | 100 | 100 | 100 | 100 | 100 | 100 | 100 | 100 | 100 |
| Depreciation | .1 | .1 | .2 | .3 | .3 | .0 | .0 | .0 | .0 | .0 |
| Depreciation, % | 100 | 100 | 100 | 100 | 100 | 100 | 100 | 100 | 100 | 100 |
| EBIT | -6.1 | -10.8 | -21.4 | -25.8 | -33.9 | .0 | .0 | .0 | .0 | .0 |
| EBIT, % | 100 | 100 | 100 | 100 | 100 | 100 | 100 | 100 | 100 | 100 |
| Total Cash | 5.2 | 54.7 | 41.6 | 29.9 | 25.0 | .0 | .0 | .0 | .0 | .0 |
| Total Cash, percent | .0 | .0 | .0 | .0 | .0 | .0 | .0 | .0 | .0 | .0 |
| Account Receivables | 1.2 | 2.3 | 3.7 | 1.3 | 2.7 | .0 | .0 | .0 | .0 | .0 |
| Account Receivables, % | 100 | 100 | 100 | 100 | 100 | 100 | 100 | 100 | 100 | 100 |
| Inventories | .0 | .0 | .0 | .0 | .0 | .0 | .0 | .0 | .0 | .0 |
| Inventories, % | 100 | 100 | 100 | 100 | 100 | 100 | 100 | 100 | 100 | 100 |
| Accounts Payable | 2.0 | 4.2 | 3.2 | 3.7 | 2.0 | .0 | .0 | .0 | .0 | .0 |
| Accounts Payable, % | 100 | 100 | 100 | 100 | 100 | 100 | 100 | 100 | 100 | 100 |
| Capital Expenditure | .0 | .0 | -.2 | -.1 | .0 | .0 | .0 | .0 | .0 | .0 |
| Capital Expenditure, % | 100 | 100 | 100 | 100 | 100 | 0 | 0 | 0 | 0 | 0 |
| Tax Rate, % | 0 | 0 | 0 | 0 | 0 | 0 | 0 | 0 | 0 | 0 |
| EBITAT | -7.8 | -10.8 | .8 | -25.8 | -33.9 | .0 | .0 | .0 | .0 | .0 |
| Depreciation | ||||||||||
| Changes in Account Receivables | ||||||||||
| Changes in Inventories | ||||||||||
| Changes in Accounts Payable | ||||||||||
| Capital Expenditure | ||||||||||
| UFCF | -6.9 | -9.7 | -1.5 | -22.8 | -36.8 | .7 | .0 | .0 | .0 | .0 |
| WACC, % | 9.48 | 9.48 | 9.43 | 9.48 | 9.48 | 9.47 | 9.47 | 9.47 | 9.47 | 9.47 |
| PV UFCF | ||||||||||
| SUM PV UFCF | .6 | |||||||||
| Long Term Growth Rate, % | 2.00 | |||||||||
| Free cash flow (T + 1) | 0 | |||||||||
| Terminal Value | 0 | |||||||||
| Present Terminal Value | 0 | |||||||||
| Enterprise Value | 1 | |||||||||
| Net Debt | -24 | |||||||||
| Equity Value | 25 | |||||||||
| Diluted Shares Outstanding, MM | 40 | |||||||||
| Equity Value Per Share | 0.63 |
What You Will Receive
- Flexible Forecast Inputs: Modify key assumptions (growth %, margins, WACC) to explore various scenarios.
- Industry-Specific Data: Cognition Therapeutics, Inc.'s (CGTX) financial information pre-loaded to facilitate your analysis.
- Instant DCF Results: The template automatically computes Net Present Value (NPV) and intrinsic value.
- Tailored and Professional: A sleek Excel model that can be customized to fit your valuation requirements.
- Designed for Analysts and Investors: Perfect for assessing projections, validating strategies, and enhancing efficiency.
Key Features
- Comprehensive Clinical Data: Access reliable pre-loaded historical performance metrics and future outlooks.
- Adjustable Research Parameters: Modify highlighted fields such as R&D expenses, market penetration rates, and profit margins.
- Real-Time Analytics: Automatic recalculations for discounted cash flow (DCF), Net Present Value (NPV), and revenue forecasts.
- Interactive Dashboard: Intuitive charts and summaries to help visualize your investment analysis.
- Suitable for All Skill Levels: A user-friendly format designed for investors, analysts, and industry professionals.
How It Works
- Step 1: Download the Excel file.
- Step 2: Review pre-entered Cognition Therapeutics data (historical and projected).
- Step 3: Adjust key assumptions (yellow cells) based on your analysis.
- Step 4: View automatic recalculations for Cognition Therapeutics’ intrinsic value.
- Step 5: Use the outputs for investment decisions or reporting.
Why Choose This Calculator for Cognition Therapeutics, Inc. (CGTX)?
- User-Friendly Interface: Tailored for both novices and seasoned professionals.
- Customizable Variables: Easily adjust parameters to suit your financial analysis.
- Real-Time Feedback: Monitor immediate updates to Cognition Therapeutics’ valuation with every input change.
- Pre-Loaded Data: Comes with Cognition Therapeutics’ actual financial figures for swift evaluations.
- Endorsed by Experts: Utilized by investors and analysts for making well-informed choices.
Who Should Use This Product?
- Investors: Evaluate Cognition Therapeutics' (CGTX) market position before making investment decisions.
- CFOs and Financial Analysts: Optimize valuation methodologies and assess financial forecasts for CGTX.
- Startup Founders: Understand the valuation strategies of biotechnology companies like Cognition Therapeutics.
- Consultants: Create comprehensive valuation reports for clients in the biopharmaceutical sector.
- Students and Educators: Utilize current data to learn and teach valuation principles in healthcare innovation.
What the Template Contains
- Comprehensive DCF Model: Editable template featuring in-depth valuation calculations.
- Real-World Data: Cognition Therapeutics, Inc. (CGTX)’s historical and projected financials preloaded for analysis.
- Customizable Parameters: Modify WACC, growth rates, and tax assumptions to explore various scenarios.
- Financial Statements: Complete annual and quarterly breakdowns for enhanced insights.
- Key Ratios: Integrated analysis for profitability, efficiency, and leverage metrics.
- Dashboard with Visual Outputs: Charts and tables designed for clear, actionable results.
Disclaimer
All information, articles, and product details provided on this website are for general informational and educational purposes only. We do not claim any ownership over, nor do we intend to infringe upon, any trademarks, copyrights, logos, brand names, or other intellectual property mentioned or depicted on this site. Such intellectual property remains the property of its respective owners, and any references here are made solely for identification or informational purposes, without implying any affiliation, endorsement, or partnership.
We make no representations or warranties, express or implied, regarding the accuracy, completeness, or suitability of any content or products presented. Nothing on this website should be construed as legal, tax, investment, financial, medical, or other professional advice. In addition, no part of this site—including articles or product references—constitutes a solicitation, recommendation, endorsement, advertisement, or offer to buy or sell any securities, franchises, or other financial instruments, particularly in jurisdictions where such activity would be unlawful.
All content is of a general nature and may not address the specific circumstances of any individual or entity. It is not a substitute for professional advice or services. Any actions you take based on the information provided here are strictly at your own risk. You accept full responsibility for any decisions or outcomes arising from your use of this website and agree to release us from any liability in connection with your use of, or reliance upon, the content or products found herein.