
|
Valoración DCF de The Chefs' Warehouse, Inc. (CHEF) |
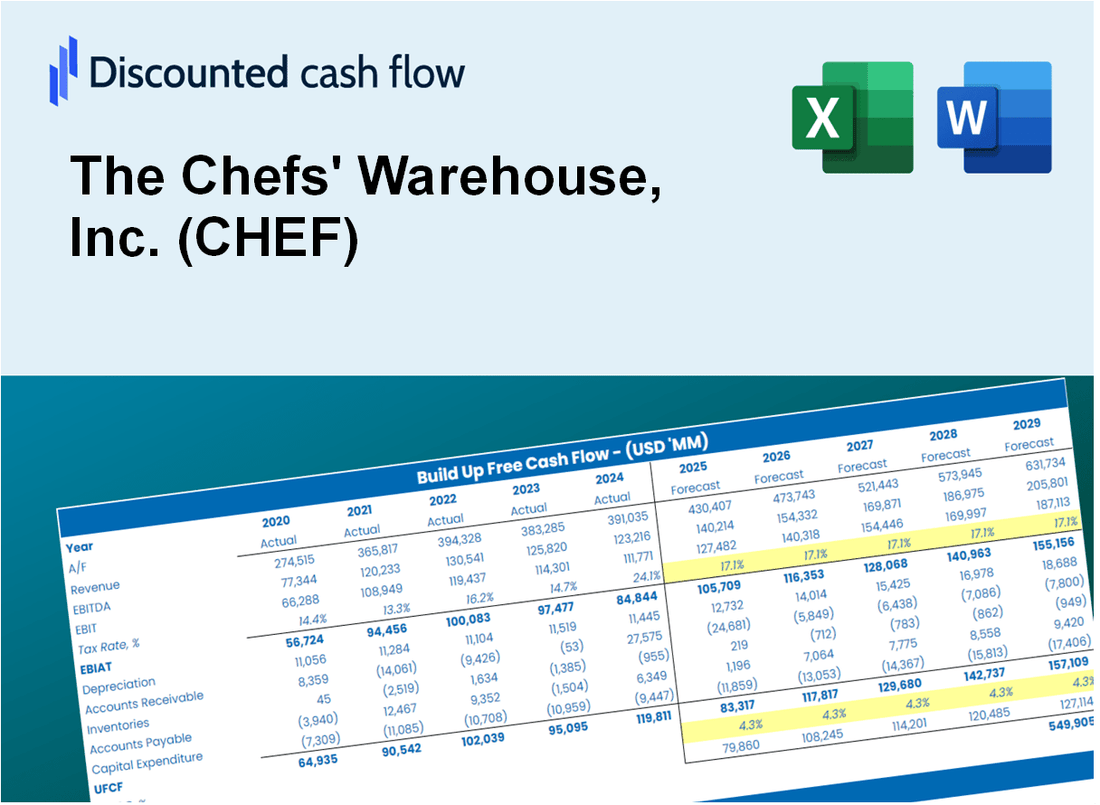
Completamente Editable: Adáptelo A Sus Necesidades En Excel O Sheets
Diseño Profesional: Plantillas Confiables Y Estándares De La Industria
Predeterminadas Para Un Uso Rápido Y Eficiente
Compatible con MAC / PC, completamente desbloqueado
No Se Necesita Experiencia; Fáciles De Seguir
The Chefs' Warehouse, Inc. (CHEF) Bundle
¡Descubra el verdadero potencial de los Chefs 'Warehouse, Inc. (Chef) con nuestra calculadora DCF de nivel experto! Ajuste los supuestos esenciales, explore varios escenarios y evalúe cómo los diferentes factores influyen en la valoración del almacén de los chefs, Inc. (chef), todo dentro de una sola plantilla de Excel.
What You Will Get
- Editable Excel Template: A fully customizable Excel-based DCF Calculator featuring pre-filled real CHEF financials.
- Real-World Data: Historical data and forward-looking estimates (as indicated in the yellow cells).
- Forecast Flexibility: Adjust forecast assumptions such as revenue growth, EBITDA %, and WACC.
- Automatic Calculations: Instantly observe how your inputs affect The Chefs' Warehouse’s valuation.
- Professional Tool: Designed for investors, CFOs, consultants, and financial analysts.
- User-Friendly Design: Organized for clarity and ease of use, complete with step-by-step instructions.
Key Features
- Real-Life CHEF Data: Pre-filled with The Chefs' Warehouse’s historical financials and future projections.
- Fully Customizable Inputs: Modify revenue growth, profit margins, WACC, tax rates, and capital expenditures.
- Dynamic Valuation Model: Automatic updates to Net Present Value (NPV) and intrinsic value based on your inputs.
- Scenario Testing: Develop multiple forecasting scenarios to evaluate different valuation outcomes.
- User-Friendly Design: Intuitive, organized, and crafted for both professionals and novices.
How It Works
- Step 1: Download the prebuilt Excel template with The Chefs' Warehouse, Inc. (CHEF) data included.
- Step 2: Explore the pre-filled sheets and familiarize yourself with the key metrics.
- Step 3: Update forecasts and assumptions in the editable yellow cells (WACC, growth, margins).
- Step 4: Instantly view recalculated results, including The Chefs' Warehouse, Inc. (CHEF) intrinsic value.
- Step 5: Make informed investment decisions or generate reports using the outputs.
Why Choose The Chefs' Warehouse, Inc. (CHEF)?
- Quality Products: We provide top-notch ingredients sourced from reliable suppliers.
- Expert Support: Our knowledgeable staff is always ready to assist with your culinary needs.
- Wide Selection: A diverse range of products to cater to all your cooking requirements.
- Convenient Ordering: Streamlined processes for easy and efficient purchasing.
- Trusted by Professionals: A go-to choice for chefs and restaurants seeking excellence.
Who Should Use This Product?
- Investors: Evaluate The Chefs' Warehouse's valuation before making stock decisions.
- CFOs and Financial Analysts: Optimize valuation methods and assess financial forecasts.
- Restaurant Owners: Understand how leading food distributors like The Chefs' Warehouse are valued.
- Consultants: Provide detailed valuation reports for clients in the food service industry.
- Students and Educators: Utilize real-world data to learn and teach valuation strategies.
What the Template Contains
- Historical Data: Includes The Chefs' Warehouse’s past financials and baseline forecasts.
- DCF and Levered DCF Models: Detailed templates to calculate The Chefs' Warehouse’s intrinsic value.
- WACC Sheet: Pre-built calculations for Weighted Average Cost of Capital.
- Editable Inputs: Modify key drivers like growth rates, EBITDA %, and CAPEX assumptions.
- Quarterly and Annual Statements: A complete breakdown of The Chefs' Warehouse’s financials.
- Interactive Dashboard: Visualize valuation results and projections dynamically.
Disclaimer
All information, articles, and product details provided on this website are for general informational and educational purposes only. We do not claim any ownership over, nor do we intend to infringe upon, any trademarks, copyrights, logos, brand names, or other intellectual property mentioned or depicted on this site. Such intellectual property remains the property of its respective owners, and any references here are made solely for identification or informational purposes, without implying any affiliation, endorsement, or partnership.
We make no representations or warranties, express or implied, regarding the accuracy, completeness, or suitability of any content or products presented. Nothing on this website should be construed as legal, tax, investment, financial, medical, or other professional advice. In addition, no part of this site—including articles or product references—constitutes a solicitation, recommendation, endorsement, advertisement, or offer to buy or sell any securities, franchises, or other financial instruments, particularly in jurisdictions where such activity would be unlawful.
All content is of a general nature and may not address the specific circumstances of any individual or entity. It is not a substitute for professional advice or services. Any actions you take based on the information provided here are strictly at your own risk. You accept full responsibility for any decisions or outcomes arising from your use of this website and agree to release us from any liability in connection with your use of, or reliance upon, the content or products found herein.