
|
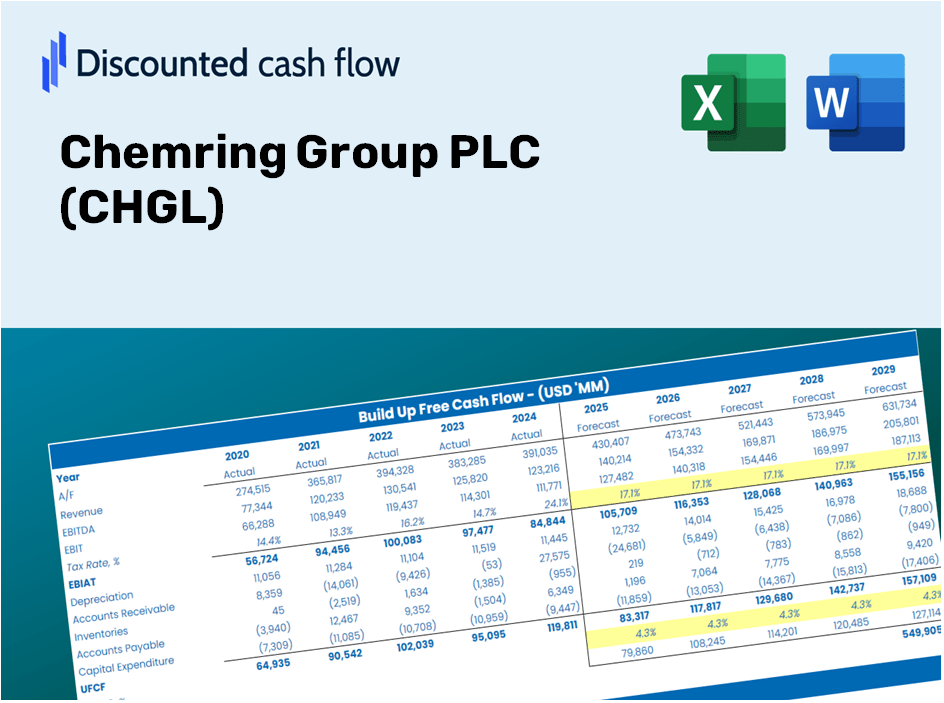
Valoración de DCF del Grupo Chemring (CHG.L) |
Completamente Editable: Adáptelo A Sus Necesidades En Excel O Sheets
Diseño Profesional: Plantillas Confiables Y Estándares De La Industria
Predeterminadas Para Un Uso Rápido Y Eficiente
Compatible con MAC / PC, completamente desbloqueado
No Se Necesita Experiencia; Fáciles De Seguir
Chemring Group PLC (CHG.L) Bundle
Ingementada para la precisión, nuestra calculadora DCF del Grupo Chemring PLC (CHGL) le permite evaluar la valoración del grupo de químico PLC con ideas financieras del mundo real y una flexibilidad completa para modificar todos los parámetros esenciales para pronósticos mejorados.
Discounted Cash Flow (DCF) - (USD MM)
| Year | AY1 2020 |
AY2 2021 |
AY3 2022 |
AY4 2023 |
AY5 2024 |
FY1 2025 |
FY2 2026 |
FY3 2027 |
FY4 2028 |
FY5 2029 |
|---|---|---|---|---|---|---|---|---|---|---|
| Revenue | 402.5 | 393.3 | 401.0 | 472.6 | 510.4 | 543.0 | 577.6 | 614.5 | 653.7 | 695.4 |
| Revenue Growth, % | 0 | -2.29 | 1.96 | 17.86 | 8 | 6.38 | 6.38 | 6.38 | 6.38 | 6.38 |
| EBITDA | 75.1 | 75.5 | 71.2 | 67.1 | 82.7 | 93.4 | 99.4 | 105.7 | 112.5 | 119.6 |
| EBITDA, % | 18.66 | 19.2 | 17.76 | 14.2 | 16.2 | 17.2 | 17.2 | 17.2 | 17.2 | 17.2 |
| Depreciation | 28.8 | 25.1 | 21.8 | 22.3 | 24.6 | 31.0 | 32.9 | 35.0 | 37.3 | 39.7 |
| Depreciation, % | 7.16 | 6.38 | 5.44 | 4.72 | 4.82 | 5.7 | 5.7 | 5.7 | 5.7 | 5.7 |
| EBIT | 46.3 | 50.4 | 49.4 | 44.8 | 58.1 | 62.4 | 66.4 | 70.7 | 75.2 | 80.0 |
| EBIT, % | 11.5 | 12.81 | 12.32 | 9.48 | 11.38 | 11.5 | 11.5 | 11.5 | 11.5 | 11.5 |
| Total Cash | 14.7 | 5.8 | 19.8 | 6.4 | 45.0 | 22.0 | 23.4 | 24.9 | 26.5 | 28.1 |
| Total Cash, percent | .0 | .0 | .0 | .0 | .0 | .0 | .0 | .0 | .0 | .0 |
| Account Receivables | 58.6 | 54.6 | 33.3 | 41.3 | 82.6 | 67.0 | 71.2 | 75.8 | 80.6 | 85.8 |
| Account Receivables, % | 14.56 | 13.88 | 8.3 | 8.74 | 16.18 | 12.33 | 12.33 | 12.33 | 12.33 | 12.33 |
| Inventories | 91.3 | 80.7 | 99.6 | 101.7 | 127.1 | 124.3 | 132.2 | 140.7 | 149.6 | 159.2 |
| Inventories, % | 22.68 | 20.52 | 24.84 | 21.52 | 24.9 | 22.89 | 22.89 | 22.89 | 22.89 | 22.89 |
| Accounts Payable | 19.9 | 13.1 | 14.7 | 16.3 | 27.9 | 22.6 | 24.1 | 25.6 | 27.3 | 29.0 |
| Accounts Payable, % | 4.94 | 3.33 | 3.67 | 3.45 | 5.47 | 4.17 | 4.17 | 4.17 | 4.17 | 4.17 |
| Capital Expenditure | -40.8 | -30.2 | -34.5 | -34.2 | -69.6 | -51.4 | -54.6 | -58.1 | -61.8 | -65.8 |
| Capital Expenditure, % | -10.14 | -7.68 | -8.6 | -7.24 | -13.64 | -9.46 | -9.46 | -9.46 | -9.46 | -9.46 |
| Tax Rate, % | 25.89 | 25.89 | 25.89 | 25.89 | 25.89 | 25.89 | 25.89 | 25.89 | 25.89 | 25.89 |
| EBITAT | 37.1 | 42.9 | 48.9 | 5.5 | 43.1 | 43.8 | 46.6 | 49.5 | 52.7 | 56.1 |
| Depreciation | ||||||||||
| Changes in Account Receivables | ||||||||||
| Changes in Inventories | ||||||||||
| Changes in Accounts Payable | ||||||||||
| Capital Expenditure | ||||||||||
| UFCF | -104.9 | 45.6 | 40.2 | -14.9 | -57.0 | 36.6 | 14.1 | 15.0 | 16.0 | 17.0 |
| WACC, % | 7.65 | 7.67 | 7.71 | 7.44 | 7.63 | 7.62 | 7.62 | 7.62 | 7.62 | 7.62 |
| PV UFCF | ||||||||||
| SUM PV UFCF | 81.9 | |||||||||
| Long Term Growth Rate, % | 2.00 | |||||||||
| Free cash flow (T + 1) | 17 | |||||||||
| Terminal Value | 308 | |||||||||
| Present Terminal Value | 214 | |||||||||
| Enterprise Value | 295 | |||||||||
| Net Debt | 53 | |||||||||
| Equity Value | 243 | |||||||||
| Diluted Shares Outstanding, MM | 279 | |||||||||
| Equity Value Per Share | 86.94 |
What You Will Receive
- Pre-Filled Financial Model: Leverage Chemring Group PLC's actual data for accurate DCF valuation.
- Comprehensive Forecast Control: Modify revenue growth, profit margins, WACC, and other essential parameters.
- Real-Time Calculations: Automatic updates allow you to view results instantly as you make adjustments.
- Professional-Grade Template: A polished Excel document crafted for high-quality valuation.
- Customizable and Reusable: Designed for adaptability, enabling ongoing use for in-depth forecasts.
Key Features
- Comprehensive CHGL Data: Pre-loaded with Chemring Group PLC’s historical financial information and future projections.
- Fully Customizable Inputs: Modify revenue growth, profit margins, WACC, tax rates, and capital expenditures as needed.
- Advanced Valuation Model: Automatic recalculations of Net Present Value (NPV) and intrinsic value based on your customized inputs.
- Scenario Analysis: Generate multiple forecasting scenarios to evaluate various valuation possibilities.
- User-Friendly Interface: Intuitive, well-structured design suitable for both professionals and novices.
How It Works
- Step 1: Download the prebuilt Excel template containing Chemring Group PLC’s (CHGL) data.
- Step 2: Review the pre-populated sheets and familiarize yourself with the key performance indicators.
- Step 3: Modify forecasts and assumptions in the editable yellow cells (WACC, growth rates, profit margins).
- Step 4: Instantly see the updated results, including Chemring Group PLC’s (CHGL) intrinsic value.
- Step 5: Make data-driven investment choices or create reports based on the outputs.
Why Select This Calculator for Chemring Group PLC (CHGL)?
- Precision: Utilizes authentic Chemring financial data for precise outcomes.
- Versatility: Built to allow users to freely experiment and adjust inputs.
- Efficiency: Eliminate the need to create a DCF model from the ground up.
- Expert-Level: Crafted with the accuracy and functionality expected at the CFO level.
- Intuitive: Simple to operate, even for those lacking extensive financial modeling skills.
Who Can Benefit from This Product?
- Finance Students: Master valuation methodologies and practice with real-world data.
- Academics: Enhance your coursework or research by integrating professional valuation models.
- Investors: Validate your investment strategies and examine valuation scenarios for Chemring Group PLC (CHGL).
- Analysts: Improve your efficiency with a ready-to-use, customizable DCF model.
- Small Business Owners: Understand how major public companies like Chemring Group PLC (CHGL) are evaluated.
Contents of the Template
- Historical Data: Contains past financial information and baseline forecasts for Chemring Group PLC (CHGL).
- DCF and Levered DCF Models: Comprehensive templates to assess the intrinsic value of Chemring Group PLC (CHGL).
- WACC Sheet: Pre-configured calculations for the Weighted Average Cost of Capital for Chemring Group PLC (CHGL).
- Editable Inputs: Adjust key variables such as growth rates, EBITDA percentages, and CAPEX assumptions.
- Quarterly and Annual Statements: An extensive analysis of Chemring Group PLC (CHGL)'s financials.
- Interactive Dashboard: Dynamic visualization of valuation results and future projections.
Disclaimer
All information, articles, and product details provided on this website are for general informational and educational purposes only. We do not claim any ownership over, nor do we intend to infringe upon, any trademarks, copyrights, logos, brand names, or other intellectual property mentioned or depicted on this site. Such intellectual property remains the property of its respective owners, and any references here are made solely for identification or informational purposes, without implying any affiliation, endorsement, or partnership.
We make no representations or warranties, express or implied, regarding the accuracy, completeness, or suitability of any content or products presented. Nothing on this website should be construed as legal, tax, investment, financial, medical, or other professional advice. In addition, no part of this site—including articles or product references—constitutes a solicitation, recommendation, endorsement, advertisement, or offer to buy or sell any securities, franchises, or other financial instruments, particularly in jurisdictions where such activity would be unlawful.
All content is of a general nature and may not address the specific circumstances of any individual or entity. It is not a substitute for professional advice or services. Any actions you take based on the information provided here are strictly at your own risk. You accept full responsibility for any decisions or outcomes arising from your use of this website and agree to release us from any liability in connection with your use of, or reliance upon, the content or products found herein.