
|
Valoración DCF de Colliers International Group Inc. (CIGI) |
Completamente Editable: Adáptelo A Sus Necesidades En Excel O Sheets
Diseño Profesional: Plantillas Confiables Y Estándares De La Industria
Predeterminadas Para Un Uso Rápido Y Eficiente
Compatible con MAC / PC, completamente desbloqueado
No Se Necesita Experiencia; Fáciles De Seguir
Colliers International Group Inc. (CIGI) Bundle
¿Busca evaluar el valor intrínseco de Colliers International Group Inc.? Nuestra calculadora DCF (CIGI) integra datos del mundo real con extensas características de personalización, lo que le permite refinar sus pronósticos y mejorar sus estrategias de inversión.
What You Will Get
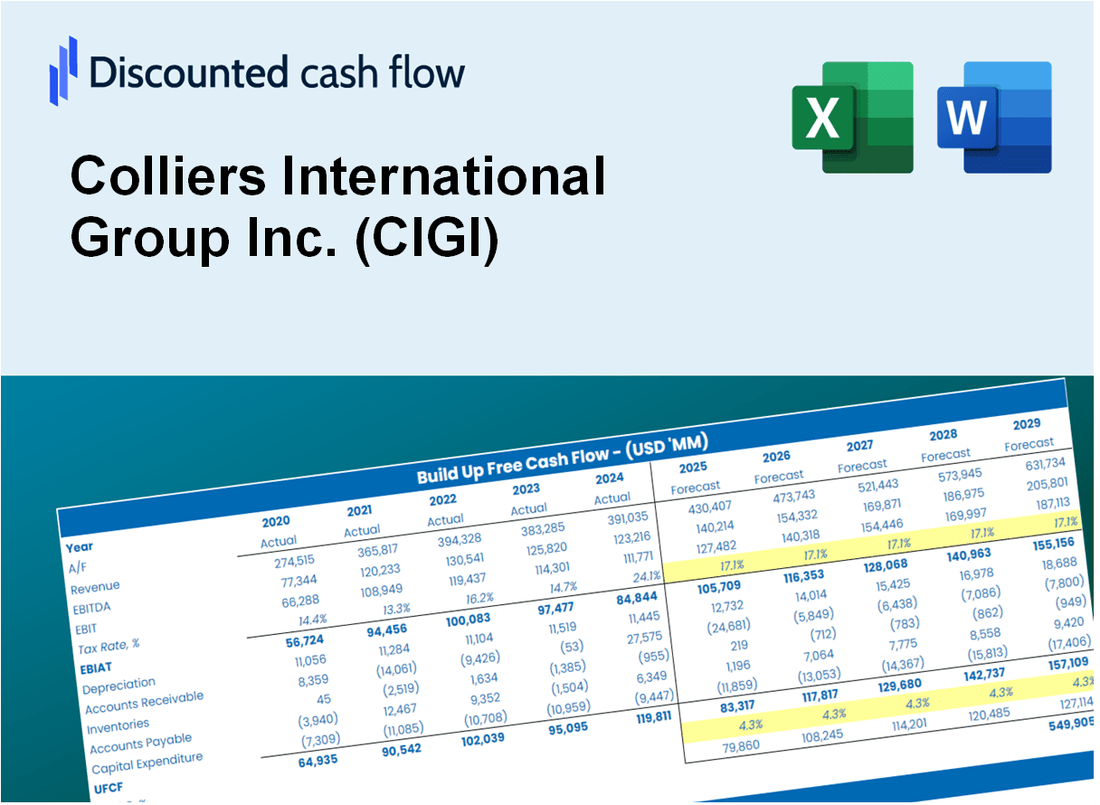
- Real Colliers Data: Preloaded financials – from revenue to EBIT – based on actual and projected figures for Colliers International Group Inc. (CIGI).
- Full Customization: Adjust all critical parameters (yellow cells) like WACC, growth %, and tax rates specific to Colliers.
- Instant Valuation Updates: Automatic recalculations to analyze the impact of changes on Colliers’ fair value.
- Versatile Excel Template: Tailored for quick edits, scenario testing, and detailed projections for Colliers International Group Inc. (CIGI).
- Time-Saving and Accurate: Skip building models from scratch while maintaining precision and flexibility for your analysis of Colliers.
Key Features
- Comprehensive CIGI Data: Equipped with Colliers International's historical performance metrics and future growth estimates.
- Customizable Assumptions: Modify parameters such as revenue growth, operating margins, discount rates, tax implications, and capital investments.
- Interactive Valuation Framework: Real-time adjustments to Net Present Value (NPV) and intrinsic value based on user-defined inputs.
- Scenario Analysis: Develop various forecasting scenarios to evaluate diverse valuation possibilities.
- Intuitive Interface: Streamlined, organized, and crafted for both industry experts and newcomers.
How It Works
- Step 1: Download the prebuilt Excel template featuring Colliers International Group Inc. (CIGI) data.
- Step 2: Review the pre-filled sheets to familiarize yourself with the essential metrics.
- Step 3: Modify forecasts and assumptions in the editable yellow cells (WACC, growth, margins).
- Step 4: Instantly see recalculated results, including Colliers International Group Inc.'s (CIGI) intrinsic value.
- Step 5: Make informed investment choices or generate reports based on the outputs.
Why Choose Colliers International Group Inc. (CIGI) Calculator?
- Comprehensive Tool: Offers DCF, WACC, and financial ratio analyses all in one convenient platform.
- Customizable Inputs: Modify the highlighted cells to explore different financial scenarios.
- Detailed Insights: Automatically computes Colliers’ intrinsic value and Net Present Value.
- Preloaded Data: Contains historical and projected data for reliable analysis.
- Professional Quality: Tailored for financial analysts, investors, and business consultants.
Who Should Use This Product?
- Investors: Accurately assess Colliers International Group Inc.’s (CIGI) market value prior to making investment choices.
- CFOs: Utilize a top-tier DCF model for comprehensive financial reporting and analysis.
- Consultants: Efficiently customize the template for client valuation reports.
- Entrepreneurs: Acquire insights into financial modeling practices employed by leading real estate firms.
- Educators: Implement it as a teaching resource to illustrate valuation techniques.
What the Template Contains
- Pre-Filled DCF Model: Colliers International Group Inc.'s (CIGI) financial data preloaded for immediate use.
- WACC Calculator: Detailed calculations for Weighted Average Cost of Capital.
- Financial Ratios: Evaluate Colliers' profitability, leverage, and efficiency.
- Editable Inputs: Change assumptions such as growth, margins, and CAPEX to fit your scenarios.
- Financial Statements: Annual and quarterly reports to support detailed analysis.
- Interactive Dashboard: Easily visualize key valuation metrics and results.
Disclaimer
All information, articles, and product details provided on this website are for general informational and educational purposes only. We do not claim any ownership over, nor do we intend to infringe upon, any trademarks, copyrights, logos, brand names, or other intellectual property mentioned or depicted on this site. Such intellectual property remains the property of its respective owners, and any references here are made solely for identification or informational purposes, without implying any affiliation, endorsement, or partnership.
We make no representations or warranties, express or implied, regarding the accuracy, completeness, or suitability of any content or products presented. Nothing on this website should be construed as legal, tax, investment, financial, medical, or other professional advice. In addition, no part of this site—including articles or product references—constitutes a solicitation, recommendation, endorsement, advertisement, or offer to buy or sell any securities, franchises, or other financial instruments, particularly in jurisdictions where such activity would be unlawful.
All content is of a general nature and may not address the specific circumstances of any individual or entity. It is not a substitute for professional advice or services. Any actions you take based on the information provided here are strictly at your own risk. You accept full responsibility for any decisions or outcomes arising from your use of this website and agree to release us from any liability in connection with your use of, or reliance upon, the content or products found herein.