
|
Centrica PLC (CNA.L) DCF Valoración |
Completamente Editable: Adáptelo A Sus Necesidades En Excel O Sheets
Diseño Profesional: Plantillas Confiables Y Estándares De La Industria
Predeterminadas Para Un Uso Rápido Y Eficiente
Compatible con MAC / PC, completamente desbloqueado
No Se Necesita Experiencia; Fáciles De Seguir
Centrica plc (CNA.L) Bundle
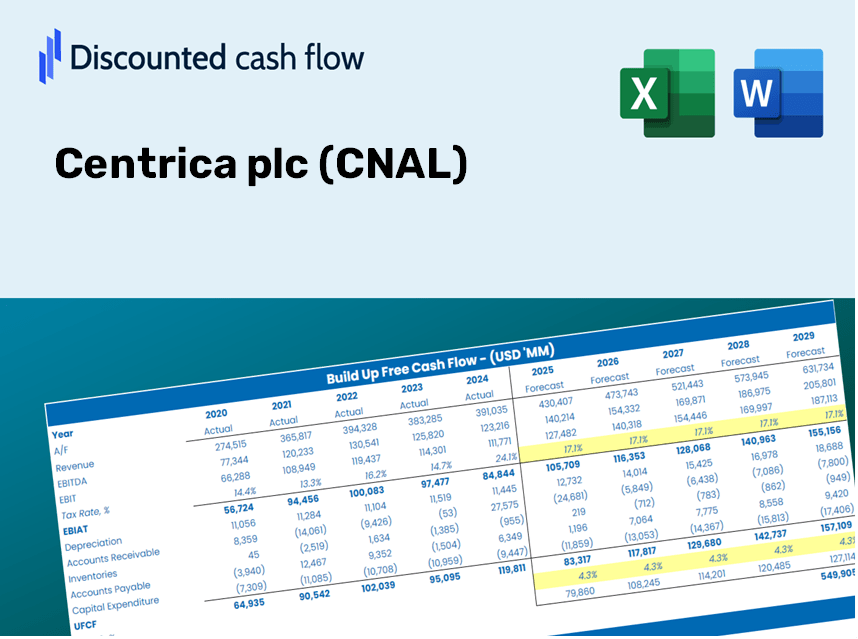
Ingementada para su precisión, nuestra calculadora DCF Centrica PLC (CNAL) le permite evaluar la valoración de Centrica utilizando datos financieros del mundo real, ofreciendo una flexibilidad completa para modificar todos los parámetros esenciales para mejorar las proyecciones.
Discounted Cash Flow (DCF) - (USD MM)
| Year | AY1 2020 |
AY2 2021 |
AY3 2022 |
AY4 2023 |
AY5 2024 |
FY1 2025 |
FY2 2026 |
FY3 2027 |
FY4 2028 |
FY5 2029 |
|---|---|---|---|---|---|---|---|---|---|---|
| Revenue | 12,249.0 | 14,744.0 | 23,741.0 | 26,458.0 | 19,913.0 | 23,303.1 | 27,270.3 | 31,912.8 | 37,345.8 | 43,703.7 |
| Revenue Growth, % | 0 | 20.37 | 61.02 | 11.44 | -24.74 | 17.02 | 17.02 | 17.02 | 17.02 | 17.02 |
| EBITDA | 488.0 | 721.0 | 410.0 | 7,075.0 | 2,421.0 | 2,307.0 | 2,699.7 | 3,159.3 | 3,697.2 | 4,326.6 |
| EBITDA, % | 3.98 | 4.89 | 1.73 | 26.74 | 12.16 | 9.9 | 9.9 | 9.9 | 9.9 | 9.9 |
| Depreciation | 883.0 | 799.0 | 669.0 | 518.0 | 473.0 | 921.8 | 1,078.8 | 1,262.4 | 1,477.3 | 1,728.8 |
| Depreciation, % | 7.21 | 5.42 | 2.82 | 1.96 | 2.38 | 3.96 | 3.96 | 3.96 | 3.96 | 3.96 |
| EBIT | -395.0 | -78.0 | -259.0 | 6,557.0 | 1,948.0 | 1,385.2 | 1,621.0 | 1,896.9 | 2,219.9 | 2,597.8 |
| EBIT, % | -3.22 | -0.52903 | -1.09 | 24.78 | 9.78 | 5.94 | 5.94 | 5.94 | 5.94 | 5.94 |
| Total Cash | 1,820.0 | 5,060.0 | 4,842.0 | 6,848.0 | 6,223.0 | 5,905.3 | 6,910.6 | 8,087.1 | 9,463.9 | 11,075.0 |
| Total Cash, percent | .0 | .0 | .0 | .0 | .0 | .0 | .0 | .0 | .0 | .0 |
| Account Receivables | 2,933.0 | 5,964.0 | 8,543.0 | 4,529.0 | 5,013.0 | 6,649.4 | 7,781.4 | 9,106.1 | 10,656.4 | 12,470.5 |
| Account Receivables, % | 23.94 | 40.45 | 35.98 | 17.12 | 25.17 | 28.53 | 28.53 | 28.53 | 28.53 | 28.53 |
| Inventories | 324.0 | 644.0 | 1,269.0 | 1,079.0 | 904.0 | 977.6 | 1,144.0 | 1,338.8 | 1,566.7 | 1,833.5 |
| Inventories, % | 2.65 | 4.37 | 5.35 | 4.08 | 4.54 | 4.2 | 4.2 | 4.2 | 4.2 | 4.2 |
| Accounts Payable | 440.0 | 542.0 | 481.0 | 474.0 | 363.0 | 601.6 | 704.0 | 823.9 | 964.2 | 1,128.3 |
| Accounts Payable, % | 3.59 | 3.68 | 2.03 | 1.79 | 1.82 | 2.58 | 2.58 | 2.58 | 2.58 | 2.58 |
| Capital Expenditure | -489.0 | -420.0 | -371.0 | -335.0 | -416.0 | -548.0 | -641.3 | -750.5 | -878.3 | -1,027.8 |
| Capital Expenditure, % | -3.99 | -2.85 | -1.56 | -1.27 | -2.09 | -2.35 | -2.35 | -2.35 | -2.35 | -2.35 |
| Tax Rate, % | 20.67 | 20.67 | 20.67 | 20.67 | 20.67 | 20.67 | 20.67 | 20.67 | 20.67 | 20.67 |
| EBITAT | 27.1 | -59.6 | -528.8 | 3,980.0 | 1,545.4 | 876.6 | 1,025.9 | 1,200.5 | 1,404.9 | 1,644.1 |
| Depreciation | ||||||||||
| Changes in Account Receivables | ||||||||||
| Changes in Inventories | ||||||||||
| Changes in Accounts Payable | ||||||||||
| Capital Expenditure | ||||||||||
| UFCF | -2,395.9 | -2,929.6 | -3,495.8 | 8,360.0 | 1,182.4 | -220.9 | 267.3 | 312.8 | 366.0 | 428.3 |
| WACC, % | 4.59 | 6.2 | 6.69 | 5.87 | 6.26 | 5.92 | 5.92 | 5.92 | 5.92 | 5.92 |
| PV UFCF | ||||||||||
| SUM PV UFCF | 904.9 | |||||||||
| Long Term Growth Rate, % | 2.00 | |||||||||
| Free cash flow (T + 1) | 437 | |||||||||
| Terminal Value | 11,145 | |||||||||
| Present Terminal Value | 8,359 | |||||||||
| Enterprise Value | 9,264 | |||||||||
| Net Debt | -2,711 | |||||||||
| Equity Value | 11,975 | |||||||||
| Diluted Shares Outstanding, MM | 5,307 | |||||||||
| Equity Value Per Share | 225.66 |
What You Will Receive
- Customizable Excel Template: A fully adaptable Excel-based DCF Calculator featuring pre-populated financial data for Centrica plc (CNAL).
- Authentic Data: Access to historical figures and forward-looking projections (highlighted in yellow cells).
- Flexible Forecasting: Adjust forecast variables such as revenue growth rates, EBITDA percentage, and WACC.
- Instant Calculations: Immediately observe how your inputs affect the valuation of Centrica plc (CNAL).
- Professional Resource: Designed for investors, CFOs, consultants, and financial analysts.
- User-Centric Layout: Organized for simplicity and ease of use, complete with step-by-step guidance.
Key Features
- 🔍 Real-Time CNAL Financial Data: Pre-loaded historical and forecasted figures for Centrica plc.
- ✏️ Customizable Inputs: Modify essential parameters (yellow cells) such as WACC, growth rates, and tax percentages.
- 📊 Comprehensive DCF Valuation: Integrated formulas assess Centrica's intrinsic value through the Discounted Cash Flow approach.
- ⚡ Immediate Results: Visualize Centrica’s valuation instantly upon adjustments.
- Scenario Analysis: Evaluate and compare results for different financial assumptions side-by-side.
How It Operates
- Download: Obtain the pre-prepared Excel spreadsheet featuring Centrica plc’s (CNAL) financial data.
- Customize: Modify projections, such as revenue growth, EBITDA %, and WACC.
- Update Automatically: The intrinsic value and NPV calculations refresh in real-time.
- Test Scenarios: Develop various forecasts and instantly evaluate different outcomes.
- Make Decisions: Utilize the valuation results to inform your investment strategy.
Why Choose This Calculator for Centrica plc (CNA)?
- All-in-One Solution: Offers DCF, WACC, and financial ratio assessments within a single tool.
- Flexible Inputs: Modify yellow-highlighted cells to explore different financial scenarios.
- In-Depth Analysis: Automatically determines Centrica’s intrinsic value and Net Present Value.
- Data Ready: Historical and projected data provide reliable starting metrics.
- High-Quality Standards: Perfect for financial analysts, investors, and business consultants alike.
Who Can Benefit from Centrica plc (CNAL)?
- Investors: Enhance your investment strategies with a robust valuation tool tailored for informed decision-making.
- Financial Analysts: Streamline your analysis using an easily customizable DCF model.
- Consultants: Effortlessly modify the template for impactful client presentations and detailed reports.
- Finance Enthusiasts: Expand your knowledge of valuation methodologies through practical, real-world case studies.
- Educators and Students: Utilize this resource as an effective practical tool in finance education.
Contents of the Template
- Historical Data: Provides Centrica plc's past financial performance and foundational forecasts.
- DCF and Leveraged DCF Models: Comprehensive templates for assessing the intrinsic value of Centrica plc (CNAL).
- WACC Sheet: Pre-configured calculations for the Weighted Average Cost of Capital.
- Editable Inputs: Adjust key factors such as growth rates, EBITDA margins, and CAPEX estimates.
- Quarterly and Annual Statements: Detailed analysis of Centrica plc’s financial statements.
- Interactive Dashboard: Dynamically visualize valuation results and future projections.
Disclaimer
All information, articles, and product details provided on this website are for general informational and educational purposes only. We do not claim any ownership over, nor do we intend to infringe upon, any trademarks, copyrights, logos, brand names, or other intellectual property mentioned or depicted on this site. Such intellectual property remains the property of its respective owners, and any references here are made solely for identification or informational purposes, without implying any affiliation, endorsement, or partnership.
We make no representations or warranties, express or implied, regarding the accuracy, completeness, or suitability of any content or products presented. Nothing on this website should be construed as legal, tax, investment, financial, medical, or other professional advice. In addition, no part of this site—including articles or product references—constitutes a solicitation, recommendation, endorsement, advertisement, or offer to buy or sell any securities, franchises, or other financial instruments, particularly in jurisdictions where such activity would be unlawful.
All content is of a general nature and may not address the specific circumstances of any individual or entity. It is not a substitute for professional advice or services. Any actions you take based on the information provided here are strictly at your own risk. You accept full responsibility for any decisions or outcomes arising from your use of this website and agree to release us from any liability in connection with your use of, or reliance upon, the content or products found herein.