
|
Valoración DCF de CN Energy Group. Inc. (CNEY) |
Completamente Editable: Adáptelo A Sus Necesidades En Excel O Sheets
Diseño Profesional: Plantillas Confiables Y Estándares De La Industria
Predeterminadas Para Un Uso Rápido Y Eficiente
Compatible con MAC / PC, completamente desbloqueado
No Se Necesita Experiencia; Fáciles De Seguir
CN Energy Group. Inc. (CNEY) Bundle
¡Mejore sus estrategias de inversión con la calculadora DCF de CN Energy Group, Inc. (CNEY)! Utilice datos financieros reales, ajuste las proyecciones y gastos de crecimiento, y observe instantáneamente cómo estas modificaciones influyen en el valor intrínseco de CN Energy Group, Inc. (CNEY).
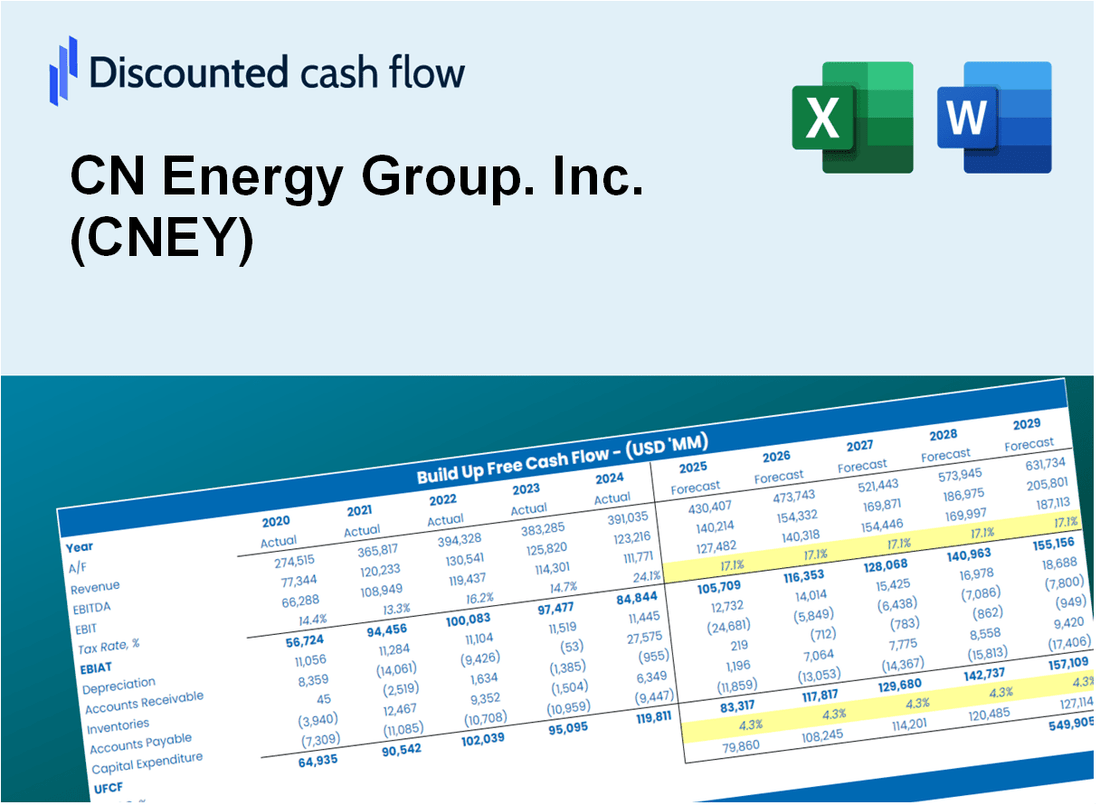
Discounted Cash Flow (DCF) - (USD MM)
| Year | AY1 2020 |
AY2 2021 |
AY3 2022 |
AY4 2023 |
AY5 2024 |
FY1 2025 |
FY2 2026 |
FY3 2027 |
FY4 2028 |
FY5 2029 |
|---|---|---|---|---|---|---|---|---|---|---|
| Revenue | 12.5 | 19.8 | 40.2 | 57.9 | 51.0 | 75.3 | 111.3 | 164.4 | 243.0 | 359.1 |
| Revenue Growth, % | 0 | 59.08 | 102.58 | 44.01 | -11.99 | 47.77 | 47.77 | 47.77 | 47.77 | 47.77 |
| EBITDA | 3.0 | 2.9 | 4.2 | -2.4 | -11.1 | 3.6 | 5.3 | 7.8 | 11.6 | 17.1 |
| EBITDA, % | 24.3 | 14.85 | 10.54 | -4.1 | -21.78 | 4.76 | 4.76 | 4.76 | 4.76 | 4.76 |
| Depreciation | 1.0 | 1.2 | 1.5 | 2.8 | 2.6 | 4.2 | 6.2 | 9.2 | 13.6 | 20.2 |
| Depreciation, % | 8.24 | 6.12 | 3.82 | 4.77 | 5.13 | 5.62 | 5.62 | 5.62 | 5.62 | 5.62 |
| EBIT | 2.0 | 1.7 | 2.7 | -5.1 | -13.7 | -.6 | -.9 | -1.4 | -2.1 | -3.1 |
| EBIT, % | 16.06 | 8.74 | 6.72 | -8.87 | -26.91 | -0.85351 | -0.85351 | -0.85351 | -0.85351 | -0.85351 |
| Total Cash | 1.6 | 3.3 | 18.0 | .2 | .3 | 11.3 | 16.7 | 24.7 | 36.4 | 53.9 |
| Total Cash, percent | .0 | .0 | .0 | .0 | .0 | .0 | .0 | .0 | .0 | .0 |
| Account Receivables | 8.7 | 33.5 | 18.9 | 29.0 | 30.5 | 49.2 | 72.7 | 107.5 | 158.9 | 234.8 |
| Account Receivables, % | 69.95 | 168.94 | 46.96 | 50.11 | 59.85 | 65.37 | 65.37 | 65.37 | 65.37 | 65.37 |
| Inventories | 2.8 | 1.1 | .8 | 41.7 | 29.8 | 24.2 | 35.7 | 52.8 | 78.1 | 115.4 |
| Inventories, % | 22.52 | 5.63 | 1.95 | 72.02 | 58.51 | 32.13 | 32.13 | 32.13 | 32.13 | 32.13 |
| Accounts Payable | 4.8 | 1.8 | 7.5 | 12.6 | .5 | 13.4 | 19.8 | 29.3 | 43.3 | 63.9 |
| Accounts Payable, % | 38.71 | 8.95 | 18.62 | 21.7 | 1.05 | 17.81 | 17.81 | 17.81 | 17.81 | 17.81 |
| Capital Expenditure | .0 | -4.2 | -3.9 | -.7 | .0 | -4.8 | -7.2 | -10.6 | -15.6 | -23.1 |
| Capital Expenditure, % | -0.15514 | -21.1 | -9.74 | -1.18 | 0 | -6.43 | -6.43 | -6.43 | -6.43 | -6.43 |
| Tax Rate, % | 0.06352452 | 0.06352452 | 0.06352452 | 0.06352452 | 0.06352452 | 0.06352452 | 0.06352452 | 0.06352452 | 0.06352452 | 0.06352452 |
| EBITAT | 1.9 | 1.3 | 2.4 | -4.9 | -13.7 | -.6 | -.9 | -1.3 | -1.9 | -2.8 |
| Depreciation | ||||||||||
| Changes in Account Receivables | ||||||||||
| Changes in Inventories | ||||||||||
| Changes in Accounts Payable | ||||||||||
| Capital Expenditure | ||||||||||
| UFCF | -3.8 | -27.8 | 20.7 | -48.8 | -12.7 | -1.4 | -30.4 | -45.0 | -66.5 | -98.2 |
| WACC, % | 7.14 | 7.14 | 7.14 | 7.14 | 7.14 | 7.14 | 7.14 | 7.14 | 7.14 | 7.14 |
| PV UFCF | ||||||||||
| SUM PV UFCF | -184.5 | |||||||||
| Long Term Growth Rate, % | 2.00 | |||||||||
| Free cash flow (T + 1) | -100 | |||||||||
| Terminal Value | -1,950 | |||||||||
| Present Terminal Value | -1,381 | |||||||||
| Enterprise Value | -1,566 | |||||||||
| Net Debt | 0 | |||||||||
| Equity Value | -1,565 | |||||||||
| Diluted Shares Outstanding, MM | 0 | |||||||||
| Equity Value Per Share | -7,834.88 |
What You Will Receive
- Comprehensive Financial Model: CN Energy Group's actual data facilitates accurate DCF valuation.
- Complete Forecasting Control: Modify revenue growth, profit margins, WACC, and other essential factors.
- Real-Time Calculations: Automatic updates provide immediate results as you adjust inputs.
- Professional-Grade Template: A polished Excel file crafted for high-quality valuation presentations.
- Flexible and Reusable: Designed for adaptability, enabling repeated use for in-depth forecasts.
Key Features
- Comprehensive DCF Model: Features detailed unlevered and levered DCF valuation frameworks tailored for CN Energy Group, Inc. (CNEY).
- WACC Analysis Tool: Pre-configured Weighted Average Cost of Capital calculator with adjustable parameters.
- Customizable Forecast Inputs: Easily alter growth projections, capital expenditures, and discount rates.
- Integrated Financial Metrics: Evaluate profitability, leverage, and efficiency ratios specific to CN Energy Group, Inc. (CNEY).
- Interactive Dashboard and Visuals: Graphical representations summarize essential valuation indicators for straightforward interpretation.
How It Works
- Step 1: Download the Excel file for CN Energy Group, Inc. (CNEY).
- Step 2: Review CN Energy's pre-filled financial data and forecasts.
- Step 3: Adjust key inputs such as revenue growth, WACC, and tax rates (highlighted cells).
- Step 4: Observe the DCF model update in real-time as you modify your assumptions.
- Step 5: Evaluate the outputs and utilize the results for your investment strategies.
Why Choose This Calculator for CN Energy Group, Inc. (CNEY)?
- Designed for Industry Experts: A sophisticated tool favored by energy analysts, CFOs, and consultants.
- Accurate Data Integration: CN Energy's historical and projected financials are preloaded for enhanced precision.
- Flexible Scenario Analysis: Effortlessly simulate various forecasts and assumptions.
- Comprehensive Outputs: Automatically computes intrinsic value, NPV, and essential financial metrics.
- User-Friendly Interface: Clear, step-by-step instructions to navigate the calculator with ease.
Who Should Use CN Energy Group, Inc. (CNEY)?
- Energy Sector Students: Understand energy market dynamics and apply analytical techniques using real-world data.
- Researchers: Utilize CN Energy's models in academic studies related to renewable energy and market analysis.
- Investors: Evaluate your investment strategies and analyze the performance metrics of CN Energy Group, Inc. (CNEY).
- Market Analysts: Enhance your analytical processes with a customizable financial model tailored for energy companies.
- Entrepreneurs in Energy: Learn from the strategies of established companies like CN Energy Group, Inc. (CNEY) to inform your own business decisions.
What the Template Contains
- Historical Data: Includes CN Energy Group, Inc.'s (CNEY) past financials and baseline forecasts.
- DCF and Levered DCF Models: Detailed templates to calculate CN Energy Group, Inc.'s (CNEY) intrinsic value.
- WACC Sheet: Pre-built calculations for Weighted Average Cost of Capital.
- Editable Inputs: Modify key drivers like growth rates, EBITDA %, and CAPEX assumptions.
- Quarterly and Annual Statements: A complete breakdown of CN Energy Group, Inc.'s (CNEY) financials.
- Interactive Dashboard: Visualize valuation results and projections dynamically.
Disclaimer
All information, articles, and product details provided on this website are for general informational and educational purposes only. We do not claim any ownership over, nor do we intend to infringe upon, any trademarks, copyrights, logos, brand names, or other intellectual property mentioned or depicted on this site. Such intellectual property remains the property of its respective owners, and any references here are made solely for identification or informational purposes, without implying any affiliation, endorsement, or partnership.
We make no representations or warranties, express or implied, regarding the accuracy, completeness, or suitability of any content or products presented. Nothing on this website should be construed as legal, tax, investment, financial, medical, or other professional advice. In addition, no part of this site—including articles or product references—constitutes a solicitation, recommendation, endorsement, advertisement, or offer to buy or sell any securities, franchises, or other financial instruments, particularly in jurisdictions where such activity would be unlawful.
All content is of a general nature and may not address the specific circumstances of any individual or entity. It is not a substitute for professional advice or services. Any actions you take based on the information provided here are strictly at your own risk. You accept full responsibility for any decisions or outcomes arising from your use of this website and agree to release us from any liability in connection with your use of, or reliance upon, the content or products found herein.