
|
Valoración DCF de Cogent Biosciences, Inc. (COGT) |
Completamente Editable: Adáptelo A Sus Necesidades En Excel O Sheets
Diseño Profesional: Plantillas Confiables Y Estándares De La Industria
Predeterminadas Para Un Uso Rápido Y Eficiente
Compatible con MAC / PC, completamente desbloqueado
No Se Necesita Experiencia; Fáciles De Seguir
Cogent Biosciences, Inc. (COGT) Bundle
¡Evalúe las perspectivas financieras de Cogent Biosciences, Inc. (COGT) como un experto! Esta calculadora DCF (COGT) proporciona datos financieros preconsados y ofrece flexibilidad total para modificar el crecimiento de los ingresos, WACC, los márgenes y otros supuestos esenciales para alinearse con sus proyecciones.
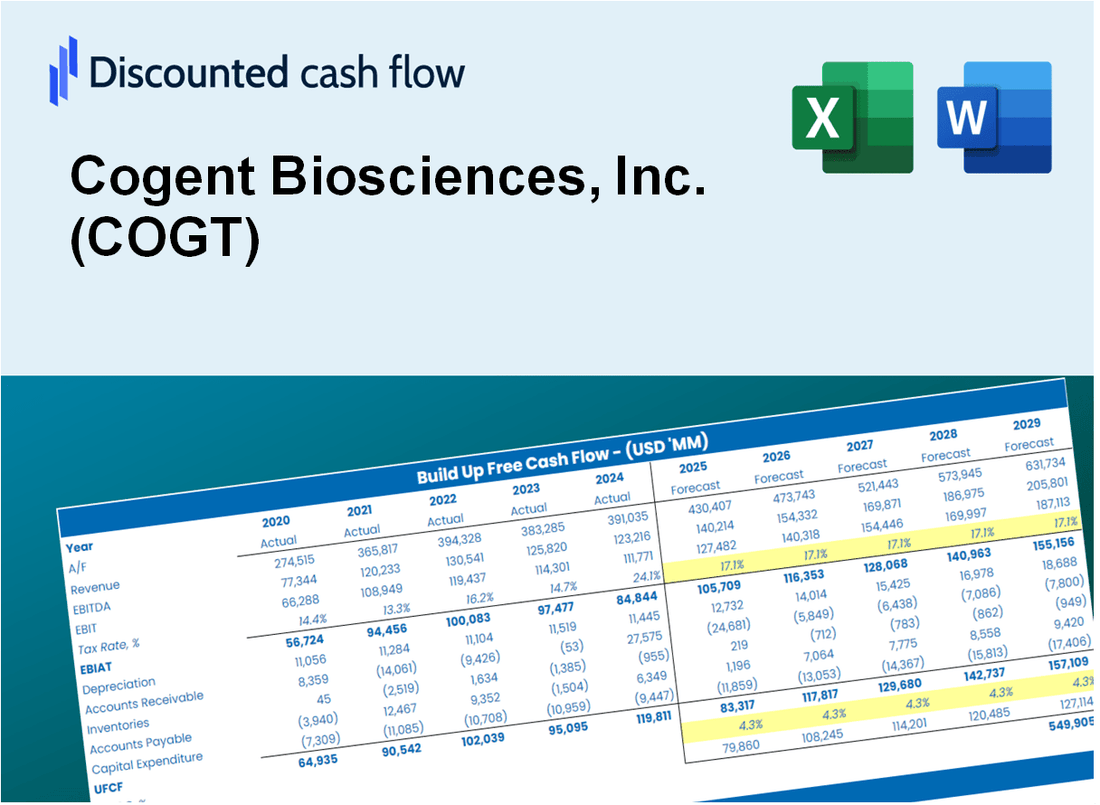
Discounted Cash Flow (DCF) - (USD MM)
| Year | AY1 2020 |
AY2 2021 |
AY3 2022 |
AY4 2023 |
AY5 2024 |
FY1 2025 |
FY2 2026 |
FY3 2027 |
FY4 2028 |
FY5 2029 |
|---|---|---|---|---|---|---|---|---|---|---|
| Revenue | 7.9 | .0 | .0 | .0 | .0 | .0 | .0 | .0 | .0 | .0 |
| Revenue Growth, % | 0 | -100 | 0 | 0 | 0 | -25 | -25 | -25 | -25 | -25 |
| EBITDA | -34.6 | -73.6 | -142.0 | -204.5 | -271.6 | .0 | .0 | .0 | .0 | .0 |
| EBITDA, % | -439.19 | 100 | 100 | 100 | 100 | 60 | 60 | 60 | 60 | 60 |
| Depreciation | .7 | 2.0 | 5.9 | 3.6 | 4.4 | .0 | .0 | .0 | .0 | .0 |
| Depreciation, % | 9.15 | 100 | 100 | 100 | 100 | 81.83 | 81.83 | 81.83 | 81.83 | 81.83 |
| EBIT | -35.3 | -75.6 | -147.8 | -208.1 | -275.9 | .0 | .0 | .0 | .0 | .0 |
| EBIT, % | -448.34 | 100 | 100 | 100 | 100 | 60 | 60 | 60 | 60 | 60 |
| Total Cash | 242.2 | 219.7 | 259.3 | 265.7 | 287.1 | .0 | .0 | .0 | .0 | .0 |
| Total Cash, percent | .0 | .0 | .0 | .0 | .0 | .0 | .0 | .0 | .0 | .0 |
| Account Receivables | .0 | .0 | .0 | .0 | .0 | .0 | .0 | .0 | .0 | .0 |
| Account Receivables, % | 0 | 100 | 100 | 100 | 100 | 80 | 80 | 80 | 80 | 80 |
| Inventories | .0 | .0 | .0 | .0 | .0 | .0 | .0 | .0 | .0 | .0 |
| Inventories, % | 0 | 100 | 100 | 100 | 100 | 80 | 80 | 80 | 80 | 80 |
| Accounts Payable | .7 | 3.5 | 5.8 | 10.7 | 12.0 | .0 | .0 | .0 | .0 | .0 |
| Accounts Payable, % | 9.3 | 100 | 100 | 100 | 100 | 81.86 | 81.86 | 81.86 | 81.86 | 81.86 |
| Capital Expenditure | .0 | -1.7 | -6.9 | -2.8 | -.6 | .0 | .0 | .0 | .0 | .0 |
| Capital Expenditure, % | 0 | 100 | 100 | 100 | 100 | 0 | 0 | 0 | 0 | 0 |
| Tax Rate, % | 0 | 0 | 0 | 0 | 0 | 0 | 0 | 0 | 0 | 0 |
| EBITAT | -35.3 | -75.6 | -147.8 | -208.1 | -275.9 | .0 | .0 | .0 | .0 | .0 |
| Depreciation | ||||||||||
| Changes in Account Receivables | ||||||||||
| Changes in Inventories | ||||||||||
| Changes in Accounts Payable | ||||||||||
| Capital Expenditure | ||||||||||
| UFCF | -33.8 | -72.5 | -146.5 | -202.5 | -270.8 | -12.0 | .0 | .0 | .0 | .0 |
| WACC, % | 6.74 | 6.74 | 6.74 | 6.74 | 6.74 | 6.74 | 6.74 | 6.74 | 6.74 | 6.74 |
| PV UFCF | ||||||||||
| SUM PV UFCF | -11.3 | |||||||||
| Long Term Growth Rate, % | 2.00 | |||||||||
| Free cash flow (T + 1) | 0 | |||||||||
| Terminal Value | 0 | |||||||||
| Present Terminal Value | 0 | |||||||||
| Enterprise Value | -11 | |||||||||
| Net Debt | -81 | |||||||||
| Equity Value | 69 | |||||||||
| Diluted Shares Outstanding, MM | 104 | |||||||||
| Equity Value Per Share | 0.67 |
What You Will Get
- Pre-Filled Financial Model: Cogent Biosciences’ actual data enables precise DCF valuation.
- Full Forecast Control: Adjust revenue growth, margins, WACC, and other key drivers.
- Instant Calculations: Automatic updates ensure you see results as you make changes.
- Investor-Ready Template: A refined Excel file designed for professional-grade valuation.
- Customizable and Reusable: Tailored for flexibility, allowing repeated use for detailed forecasts.
Key Features
- Customizable Research Parameters: Adjust essential inputs such as drug development timelines, market penetration rates, and R&D expenditures.
- Instant Valuation Calculations: Provides real-time assessments of intrinsic value, NPV, and additional metrics.
- High-Precision Analytics: Leverages Cogent Biosciences’ real-world data for accurate valuation insights.
- Effortless Scenario Modeling: Evaluate various hypotheses and analyze results with ease.
- Efficiency Booster: Streamlines the process, removing the need for complex financial modeling from the ground up.
How It Works
- 1. Access the Template: Download and open the Excel file containing Cogent Biosciences, Inc.'s (COGT) preloaded data.
- 2. Adjust Key Inputs: Modify essential parameters such as revenue growth rates, discount rates, and research & development expenditures.
- 3. Analyze Results in Real-Time: The DCF model automatically computes intrinsic value and net present value (NPV).
- 4. Explore Different Scenarios: Evaluate various projections to understand diverse valuation results.
- 5. Make Informed Decisions: Share expert valuation insights to guide your strategic choices.
Why Choose This Calculator for Cogent Biosciences, Inc. (COGT)?
- Precision: Utilizes accurate financial data specific to Cogent Biosciences.
- Adaptability: Tailored for users to easily adjust and experiment with inputs.
- Efficiency: Eliminates the need to create a financial model from the ground up.
- High-Quality: Crafted with the expertise and standards expected by industry professionals.
- Intuitive: Simple interface suitable for users without extensive financial modeling knowledge.
Who Should Use Cogent Biosciences, Inc. (COGT)?
- Investors: Gain insights into innovative therapies with a reliable analysis platform.
- Healthcare Analysts: Streamline your research with comprehensive data on biotech advancements.
- Consultants: Tailor presentations or reports efficiently using our customizable templates.
- Biotech Enthusiasts: Enhance your knowledge of drug development processes through real-case studies.
- Educators and Students: Utilize it as a valuable resource in biotechnology and finance education.
What the Template Contains
- Pre-Filled Data: Includes Cogent Biosciences’ historical financials and forecasts.
- Discounted Cash Flow Model: Editable DCF valuation model with automatic calculations.
- Weighted Average Cost of Capital (WACC): A dedicated sheet for calculating WACC based on custom inputs.
- Key Financial Ratios: Analyze Cogent Biosciences’ profitability, efficiency, and leverage.
- Customizable Inputs: Edit revenue growth, margins, and tax rates with ease.
- Clear Dashboard: Charts and tables summarizing key valuation results.
Disclaimer
All information, articles, and product details provided on this website are for general informational and educational purposes only. We do not claim any ownership over, nor do we intend to infringe upon, any trademarks, copyrights, logos, brand names, or other intellectual property mentioned or depicted on this site. Such intellectual property remains the property of its respective owners, and any references here are made solely for identification or informational purposes, without implying any affiliation, endorsement, or partnership.
We make no representations or warranties, express or implied, regarding the accuracy, completeness, or suitability of any content or products presented. Nothing on this website should be construed as legal, tax, investment, financial, medical, or other professional advice. In addition, no part of this site—including articles or product references—constitutes a solicitation, recommendation, endorsement, advertisement, or offer to buy or sell any securities, franchises, or other financial instruments, particularly in jurisdictions where such activity would be unlawful.
All content is of a general nature and may not address the specific circumstances of any individual or entity. It is not a substitute for professional advice or services. Any actions you take based on the information provided here are strictly at your own risk. You accept full responsibility for any decisions or outcomes arising from your use of this website and agree to release us from any liability in connection with your use of, or reliance upon, the content or products found herein.