
|
Valoración DCF de Coinbase Global, Inc. (COIN) |
Completamente Editable: Adáptelo A Sus Necesidades En Excel O Sheets
Diseño Profesional: Plantillas Confiables Y Estándares De La Industria
Predeterminadas Para Un Uso Rápido Y Eficiente
Compatible con MAC / PC, completamente desbloqueado
No Se Necesita Experiencia; Fáciles De Seguir
Coinbase Global, Inc. (COIN) Bundle
¡Obtenga información sobre su análisis de valoración de Coinbase Global, Inc. (Coin) utilizando nuestra sofisticada calculadora DCF! Esta plantilla de Excel se precisa con datos reales (monedas), lo que le permite ajustar los pronósticos y supuestos para un cálculo preciso del valor intrínseco de Coinbase.
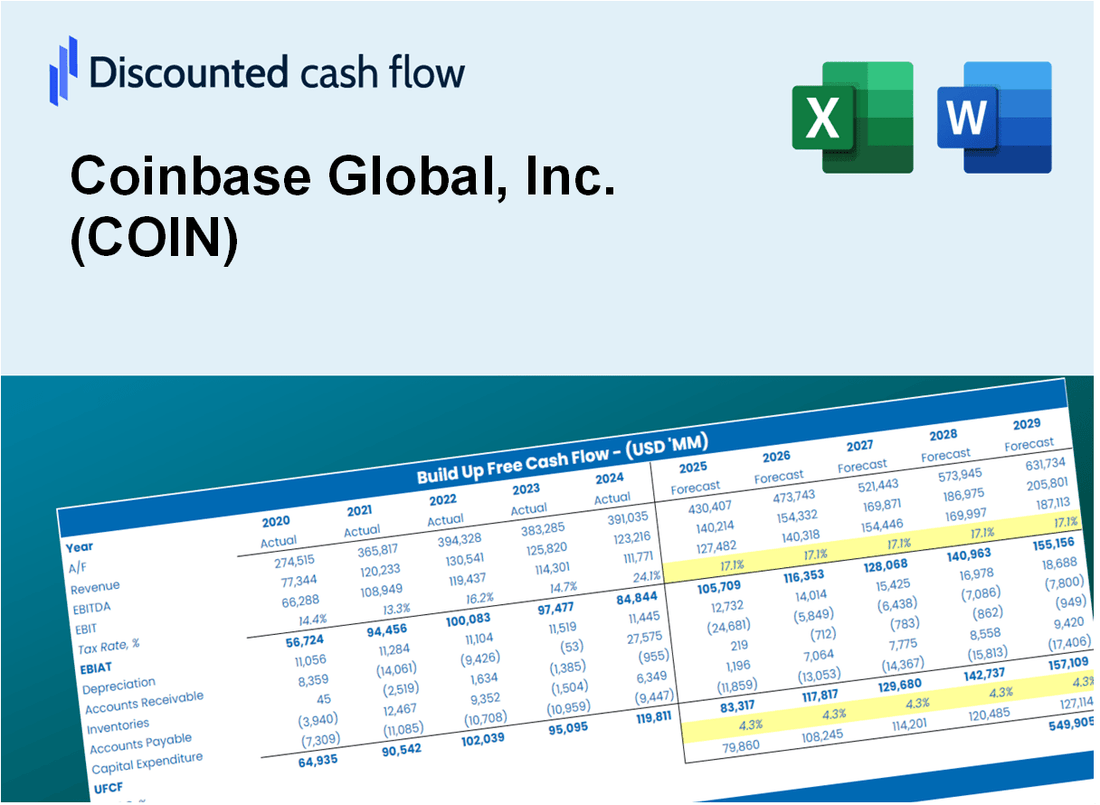
Discounted Cash Flow (DCF) - (USD MM)
| Year | AY1 2020 |
AY2 2021 |
AY3 2022 |
AY4 2023 |
AY5 2024 |
FY1 2025 |
FY2 2026 |
FY3 2027 |
FY4 2028 |
FY5 2029 |
|---|---|---|---|---|---|---|---|---|---|---|
| Revenue | 1,277.5 | 7,839.4 | 3,194.2 | 3,108.4 | 6,564.0 | 8,829.6 | 11,877.1 | 15,976.4 | 21,490.6 | 28,908.0 |
| Revenue Growth, % | 0 | 513.66 | -59.25 | -2.69 | 111.17 | 34.51 | 34.51 | 34.51 | 34.51 | 34.51 |
| EBITDA | 439.9 | 3,119.8 | -2,821.6 | 145.6 | 3,150.8 | 681.3 | 916.4 | 1,232.8 | 1,658.2 | 2,230.6 |
| EBITDA, % | 34.44 | 39.8 | -88.34 | 4.68 | 48 | 7.72 | 7.72 | 7.72 | 7.72 | 7.72 |
| Depreciation | 31.0 | 63.7 | 154.1 | 139.6 | 127.5 | 256.0 | 344.3 | 463.1 | 623.0 | 838.0 |
| Depreciation, % | 2.42 | 0.81193 | 4.82 | 4.49 | 1.94 | 2.9 | 2.9 | 2.9 | 2.9 | 2.9 |
| EBIT | 409.0 | 3,056.1 | -2,975.7 | 5.9 | 3,023.3 | 425.3 | 572.1 | 769.6 | 1,035.3 | 1,392.6 |
| EBIT, % | 32.01 | 38.98 | -93.16 | 0.19048 | 46.06 | 4.82 | 4.82 | 4.82 | 4.82 | 4.82 |
| Total Cash | 1,110.8 | 7,223.6 | 5,286.2 | 5,525.4 | 9,548.1 | 8,460.4 | 11,380.5 | 15,308.4 | 20,592.1 | 27,699.4 |
| Total Cash, percent | .0 | .0 | .0 | .0 | .0 | .0 | .0 | .0 | .0 | .0 |
| Account Receivables | 189.5 | 365.9 | 464.8 | 631.1 | 914.9 | 1,206.0 | 1,622.2 | 2,182.1 | 2,935.3 | 3,948.4 |
| Account Receivables, % | 14.83 | 4.67 | 14.55 | 20.3 | 13.94 | 13.66 | 13.66 | 13.66 | 13.66 | 13.66 |
| Inventories | .0 | .0 | .0 | .0 | .0 | .0 | .0 | .0 | .0 | .0 |
| Inventories, % | 0 | 0 | 0 | 0 | 0 | 0 | 0 | 0 | 0 | 0 |
| Accounts Payable | 12.0 | 39.8 | 56.0 | 39.3 | 63.3 | 95.9 | 129.1 | 173.6 | 233.5 | 314.1 |
| Accounts Payable, % | 0.94178 | 0.50811 | 1.75 | 1.26 | 0.96459 | 1.09 | 1.09 | 1.09 | 1.09 | 1.09 |
| Capital Expenditure | -18.8 | -82.9 | -2.9 | .0 | .0 | -46.3 | -62.3 | -83.7 | -112.6 | -151.5 |
| Capital Expenditure, % | -1.47 | -1.06 | -0.09182245 | 0 | 0 | -0.52415 | -0.52415 | -0.52415 | -0.52415 | -0.52415 |
| Tax Rate, % | 12.36 | 12.36 | 12.36 | 12.36 | 12.36 | 12.36 | 12.36 | 12.36 | 12.36 | 12.36 |
| EBITAT | 322.1 | 3,659.0 | -2,548.8 | -7.3 | 2,649.7 | 299.5 | 402.9 | 541.9 | 729.0 | 980.6 |
| Depreciation | ||||||||||
| Changes in Account Receivables | ||||||||||
| Changes in Inventories | ||||||||||
| Changes in Accounts Payable | ||||||||||
| Capital Expenditure | ||||||||||
| UFCF | 156.8 | 3,491.1 | -2,480.3 | -50.7 | 2,517.4 | 250.8 | 301.8 | 405.9 | 546.0 | 734.5 |
| WACC, % | 20.07 | 20.11 | 20.08 | 19.9 | 20.08 | 20.05 | 20.05 | 20.05 | 20.05 | 20.05 |
| PV UFCF | ||||||||||
| SUM PV UFCF | 1,210.4 | |||||||||
| Long Term Growth Rate, % | 2.00 | |||||||||
| Free cash flow (T + 1) | 749 | |||||||||
| Terminal Value | 4,151 | |||||||||
| Present Terminal Value | 1,665 | |||||||||
| Enterprise Value | 2,875 | |||||||||
| Net Debt | -3,914 | |||||||||
| Equity Value | 6,790 | |||||||||
| Diluted Shares Outstanding, MM | 273 | |||||||||
| Equity Value Per Share | 24.84 |
What You Will Get
- Real Coinbase Data: Preloaded financials – from revenue to EBIT – based on actual and projected figures.
- Full Customization: Adjust all critical parameters (yellow cells) like WACC, growth %, and tax rates.
- Instant Valuation Updates: Automatic recalculations to analyze the impact of changes on Coinbase’s fair value.
- Versatile Excel Template: Tailored for quick edits, scenario testing, and detailed projections.
- Time-Saving and Accurate: Skip building models from scratch while maintaining precision and flexibility.
Key Features
- Accurate Coinbase Financials: Access reliable pre-loaded historical data and future forecasts for Coinbase Global, Inc. (COIN).
- Adjustable Projection Assumptions: Modify highlighted cells to customize metrics like WACC, growth rates, and profit margins.
- Real-Time Calculations: Instant updates to DCF, Net Present Value (NPV), and cash flow evaluations.
- Interactive Dashboard: User-friendly charts and summaries to effectively visualize your valuation outcomes.
- Designed for All Users: An intuitive layout tailored for investors, CFOs, and financial consultants alike.
How It Works
- Step 1: Download the prebuilt Excel template featuring Coinbase's data included.
- Step 2: Navigate through the pre-filled sheets to familiarize yourself with the essential metrics.
- Step 3: Adjust forecasts and assumptions in the editable yellow cells (WACC, growth, margins).
- Step 4: Instantly see the recalculated results, including Coinbase's intrinsic value.
- Step 5: Make informed investment decisions or create reports based on the outputs.
Why Choose Coinbase Global, Inc. (COIN)?
- Streamlined Transactions: Effortlessly buy, sell, and trade cryptocurrencies with a user-friendly interface.
- Enhanced Security: Advanced security measures protect your assets and personal information.
- Diverse Offerings: Access a wide range of cryptocurrencies and investment options.
- Real-Time Insights: Stay informed with up-to-date market data and analytical tools.
- Backed by Experts: Rely on a platform trusted by millions of users and industry professionals.
Who Should Use This Product?
- Investors: Evaluate Coinbase's valuation before making investment decisions.
- CFOs and Financial Analysts: Optimize valuation methodologies and validate financial forecasts.
- Startup Founders: Understand how leading cryptocurrency companies like Coinbase are assessed.
- Consultants: Create comprehensive valuation reports for diverse clientele.
- Students and Educators: Utilize current market data to practice and instruct on valuation strategies.
What the Template Contains
- Pre-Filled DCF Model: Coinbase's financial data preloaded for immediate use.
- WACC Calculator: Detailed calculations for Weighted Average Cost of Capital.
- Financial Ratios: Evaluate Coinbase's profitability, leverage, and efficiency.
- Editable Inputs: Change assumptions such as growth, margins, and CAPEX to fit your scenarios.
- Financial Statements: Annual and quarterly reports to support detailed analysis.
- Interactive Dashboard: Easily visualize key valuation metrics and results.
Disclaimer
All information, articles, and product details provided on this website are for general informational and educational purposes only. We do not claim any ownership over, nor do we intend to infringe upon, any trademarks, copyrights, logos, brand names, or other intellectual property mentioned or depicted on this site. Such intellectual property remains the property of its respective owners, and any references here are made solely for identification or informational purposes, without implying any affiliation, endorsement, or partnership.
We make no representations or warranties, express or implied, regarding the accuracy, completeness, or suitability of any content or products presented. Nothing on this website should be construed as legal, tax, investment, financial, medical, or other professional advice. In addition, no part of this site—including articles or product references—constitutes a solicitation, recommendation, endorsement, advertisement, or offer to buy or sell any securities, franchises, or other financial instruments, particularly in jurisdictions where such activity would be unlawful.
All content is of a general nature and may not address the specific circumstances of any individual or entity. It is not a substitute for professional advice or services. Any actions you take based on the information provided here are strictly at your own risk. You accept full responsibility for any decisions or outcomes arising from your use of this website and agree to release us from any liability in connection with your use of, or reliance upon, the content or products found herein.