
|
Core Scientific, Inc. Tranche 2 Warrants (Corzz) DCF Valoración |
Completamente Editable: Adáptelo A Sus Necesidades En Excel O Sheets
Diseño Profesional: Plantillas Confiables Y Estándares De La Industria
Predeterminadas Para Un Uso Rápido Y Eficiente
Compatible con MAC / PC, completamente desbloqueado
No Se Necesita Experiencia; Fáciles De Seguir
Core Scientific, Inc. Tranche 2 Warrants (CORZZ) Bundle
¡Evalúe Core Scientific, Inc. Tranche 2 Warrants (CORZZ) Outpecting financiero con experiencia! Esta calculadora DCF (Corzz) proporciona datos financieros precargados junto con la flexibilidad para modificar el crecimiento de los ingresos, WACC, los márgenes y otros supuestos esenciales para alinearse con sus proyecciones.
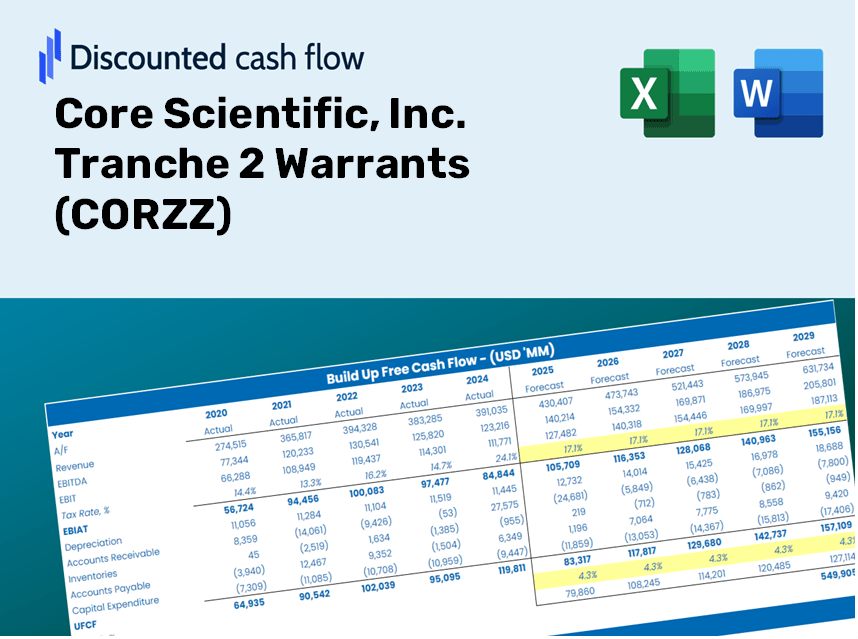
Discounted Cash Flow (DCF) - (USD MM)
| Year | AY1 2020 |
AY2 2021 |
AY3 2022 |
AY4 2023 |
AY5 2024 |
FY1 2025 |
FY2 2026 |
FY3 2027 |
FY4 2028 |
FY5 2029 |
|---|---|---|---|---|---|---|---|---|---|---|
| Revenue | 60.3 | 544.5 | 640.3 | 502.4 | 510.7 | 635.4 | 790.6 | 983.8 | 1,224.1 | 1,523.1 |
| Revenue Growth, % | 0 | 802.66 | 17.6 | -21.54 | 1.65 | 24.43 | 24.43 | 24.43 | 24.43 | 24.43 |
| EBITDA | -2.7 | 167.6 | -1,840.5 | -63.1 | -1,157.0 | -236.8 | -294.6 | -366.6 | -456.1 | -567.5 |
| EBITDA, % | -4.54 | 30.78 | -287.44 | -12.56 | -226.56 | -37.26 | -37.26 | -37.26 | -37.26 | -37.26 |
| Depreciation | 9.4 | 33.4 | 226.1 | 96.4 | 120.1 | 126.8 | 157.7 | 196.2 | 244.2 | 303.8 |
| Depreciation, % | 15.59 | 6.13 | 35.31 | 19.2 | 23.52 | 19.95 | 19.95 | 19.95 | 19.95 | 19.95 |
| EBIT | -12.1 | 134.2 | -2,066.6 | -159.6 | -1,277.1 | -288.8 | -359.3 | -447.1 | -556.3 | -692.2 |
| EBIT, % | -20.12 | 24.66 | -322.75 | -31.76 | -250.08 | -45.45 | -45.45 | -45.45 | -45.45 | -45.45 |
| Total Cash | 8.7 | 117.9 | 15.9 | 50.4 | 836.2 | 188.8 | 234.9 | 292.2 | 363.6 | 452.5 |
| Total Cash, percent | .0 | .0 | .0 | .0 | .0 | .0 | .0 | .0 | .0 | .0 |
| Account Receivables | 1.1 | 1.7 | .3 | 7.2 | 1.0 | 4.8 | 6.0 | 7.5 | 9.3 | 11.6 |
| Account Receivables, % | 1.84 | 0.30892 | 0.04013662 | 1.42 | 0.20072 | 0.76199 | 0.76199 | 0.76199 | 0.76199 | 0.76199 |
| Inventories | 58.3 | .0 | .0 | .0 | .0 | 122.8 | 152.9 | 190.2 | 236.7 | 294.5 |
| Inventories, % | 96.67 | 0 | 0 | 0 | 0 | 19.33 | 19.33 | 19.33 | 19.33 | 19.33 |
| Accounts Payable | 3.1 | 11.6 | 53.6 | 154.8 | 19.3 | 63.7 | 79.3 | 98.7 | 122.8 | 152.8 |
| Accounts Payable, % | 5.07 | 2.13 | 8.38 | 30.8 | 3.77 | 10.03 | 10.03 | 10.03 | 10.03 | 10.03 |
| Capital Expenditure | -1.6 | -59.3 | -384.0 | -16.2 | -95.0 | -121.1 | -150.6 | -187.4 | -233.2 | -290.2 |
| Capital Expenditure, % | -2.6 | -10.89 | -59.97 | -3.22 | -18.6 | -19.05 | -19.05 | -19.05 | -19.05 | -19.05 |
| Tax Rate, % | -0.06536564 | -0.06536564 | -0.06536564 | -0.06536564 | -0.06536564 | -0.06536564 | -0.06536564 | -0.06536564 | -0.06536564 | -0.06536564 |
| EBITAT | -12.1 | 100.7 | -2,050.3 | -160.0 | -1,277.9 | -273.9 | -340.8 | -424.0 | -527.6 | -656.5 |
| Depreciation | ||||||||||
| Changes in Account Receivables | ||||||||||
| Changes in Inventories | ||||||||||
| Changes in Accounts Payable | ||||||||||
| Capital Expenditure | ||||||||||
| UFCF | -60.7 | 141.1 | -2,164.7 | 14.5 | -1,382.1 | -350.4 | -349.3 | -434.6 | -540.8 | -672.9 |
| WACC, % | 28.57 | 28.4 | 28.57 | 28.57 | 28.57 | 28.54 | 28.54 | 28.54 | 28.54 | 28.54 |
| PV UFCF | ||||||||||
| SUM PV UFCF | -1,078.6 | |||||||||
| Long Term Growth Rate, % | 2.00 | |||||||||
| Free cash flow (T + 1) | -686 | |||||||||
| Terminal Value | -2,587 | |||||||||
| Present Terminal Value | -737 | |||||||||
| Enterprise Value | -1,816 | |||||||||
| Net Debt | 364 | |||||||||
| Equity Value | -2,179 | |||||||||
| Diluted Shares Outstanding, MM | 256 | |||||||||
| Equity Value Per Share | -8.52 |
What You Will Receive
- Genuine CORZZ Financial Data: Pre-loaded with Core Scientific’s historical and forecasted figures for accurate assessments.
- Fully Customizable Template: Easily adjust crucial inputs such as revenue growth, WACC, and EBITDA percentage.
- Instant Calculations: Watch the intrinsic value of Core Scientific update immediately based on your modifications.
- Expert Valuation Tool: Tailored for investors, analysts, and consultants aiming for precise DCF outcomes.
- Intuitive Design: Streamlined layout and straightforward instructions suitable for all skill levels.
Core Scientific, Inc. (CORZZ) Key Features
- Pre-Loaded Data: Historical financial statements and pre-filled forecasts for Core Scientific, Inc.
- Fully Customizable Inputs: Adjust WACC, tax rates, revenue growth, and EBITDA margins as needed.
- Real-Time Results: Watch the recalculation of Core Scientific’s intrinsic value instantly.
- Clear Visual Outputs: Dashboard graphs illustrate valuation outcomes and essential metrics.
- Designed for Precision: A professional-grade tool tailored for analysts, investors, and finance professionals.
How It Functions
- Download: Obtain the ready-to-use Excel file featuring Core Scientific, Inc.'s (CORZZ) financial data.
- Customize: Modify forecasts, such as revenue growth, EBITDA %, and WACC as per your needs.
- Update Instantly: The intrinsic value and NPV calculations refresh in real-time.
- Evaluate Scenarios: Create various projections and swiftly compare the results.
- Make Informed Decisions: Utilize the valuation findings to shape your investment strategy.
Why Choose This Calculator for Core Scientific, Inc. Tranche 2 Warrants (CORZZ)?
- Precise Data: Leverage accurate Core Scientific financials for trustworthy valuation outcomes.
- Flexible Options: Tailor essential variables such as growth rates, WACC, and tax rates to align with your forecasts.
- Efficiency Boost: Ready-made calculations save you from starting from square one.
- Professional-Quality Instrument: Crafted for investors, analysts, and consultants alike.
- Easy to Use: User-friendly design and clear instructions make it accessible for everyone.
Who Should Consider Core Scientific, Inc. Tranche 2 Warrants (CORZZ)?
- Individual Investors: Make informed choices regarding the acquisition or sale of Core Scientific warrants.
- Financial Analysts: Enhance valuation methodologies with readily available financial models tailored for warrants.
- Consultants: Provide clients with swift and accurate valuation insights related to Core Scientific warrants.
- Business Owners: Gain insights into how warrants like those from Core Scientific are valued to inform your own business strategies.
- Finance Students: Explore real-world data and scenarios to master valuation techniques involving warrants.
Contents of the Template
- Historical Performance: Provides Core Scientific, Inc.'s past financial data and foundational forecasts.
- DCF and Levered DCF Models: Comprehensive templates designed to assess the intrinsic value of Core Scientific, Inc. (CORZZ).
- WACC Sheet: Pre-constructed calculations for the Weighted Average Cost of Capital.
- Customizable Inputs: Adjust essential variables such as growth rates, EBITDA %, and CAPEX estimates.
- Quarterly and Annual Reports: An exhaustive overview of Core Scientific, Inc.'s financial performance.
- Interactive Dashboard: Dynamically visualize valuation outcomes and projections.
Disclaimer
All information, articles, and product details provided on this website are for general informational and educational purposes only. We do not claim any ownership over, nor do we intend to infringe upon, any trademarks, copyrights, logos, brand names, or other intellectual property mentioned or depicted on this site. Such intellectual property remains the property of its respective owners, and any references here are made solely for identification or informational purposes, without implying any affiliation, endorsement, or partnership.
We make no representations or warranties, express or implied, regarding the accuracy, completeness, or suitability of any content or products presented. Nothing on this website should be construed as legal, tax, investment, financial, medical, or other professional advice. In addition, no part of this site—including articles or product references—constitutes a solicitation, recommendation, endorsement, advertisement, or offer to buy or sell any securities, franchises, or other financial instruments, particularly in jurisdictions where such activity would be unlawful.
All content is of a general nature and may not address the specific circumstances of any individual or entity. It is not a substitute for professional advice or services. Any actions you take based on the information provided here are strictly at your own risk. You accept full responsibility for any decisions or outcomes arising from your use of this website and agree to release us from any liability in connection with your use of, or reliance upon, the content or products found herein.