
|
Valoración de DCF de Covivio Hotels (Covh.PA) |
Completamente Editable: Adáptelo A Sus Necesidades En Excel O Sheets
Diseño Profesional: Plantillas Confiables Y Estándares De La Industria
Predeterminadas Para Un Uso Rápido Y Eficiente
Compatible con MAC / PC, completamente desbloqueado
No Se Necesita Experiencia; Fáciles De Seguir
Covivio Hotels (COVH.PA) Bundle
¡Descubra el verdadero potencial de Covivio Hotels con nuestra calculadora DCF de primer nivel! Ajuste los supuestos clave, explore varios escenarios y evalúe cómo los cambios afectan la valoración de Covivio Hotels, todo dentro de una sola plantilla de Excel.
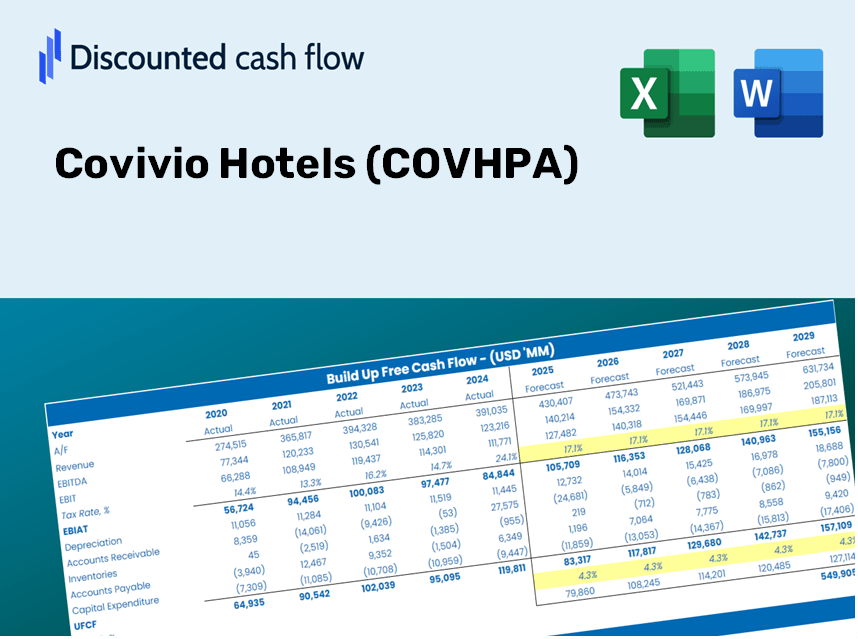
Discounted Cash Flow (DCF) - (USD MM)
| Year | AY1 2020 |
AY2 2021 |
AY3 2022 |
AY4 2023 |
AY5 2024 |
FY1 2025 |
FY2 2026 |
FY3 2027 |
FY4 2028 |
FY5 2029 |
|---|---|---|---|---|---|---|---|---|---|---|
| Revenue | 242.9 | 290.3 | 471.3 | 551.0 | 585.5 | 739.3 | 933.4 | 1,178.5 | 1,488.0 | 1,878.7 |
| Revenue Growth, % | 0 | 19.51 | 62.35 | 16.92 | 6.26 | 26.26 | 26.26 | 26.26 | 26.26 | 26.26 |
| EBITDA | 119.2 | 231.4 | 321.2 | 88.9 | 956.0 | 462.9 | 584.4 | 737.9 | 931.7 | 1,176.4 |
| EBITDA, % | 49.07 | 79.71 | 68.15 | 16.13 | 163.28 | 62.61 | 62.61 | 62.61 | 62.61 | 62.61 |
| Depreciation | 50.8 | 42.3 | 41.1 | 48.2 | 575.0 | 223.5 | 282.2 | 356.3 | 449.9 | 568.0 |
| Depreciation, % | 20.9 | 14.59 | 8.73 | 8.75 | 98.21 | 30.24 | 30.24 | 30.24 | 30.24 | 30.24 |
| EBIT | 68.4 | 189.0 | 280.0 | 40.7 | 381.0 | 332.9 | 420.4 | 530.7 | 670.1 | 846.1 |
| EBIT, % | 28.17 | 65.13 | 59.42 | 7.39 | 65.07 | 45.04 | 45.04 | 45.04 | 45.04 | 45.04 |
| Total Cash | 101.8 | 145.2 | 127.4 | 108.8 | 577.0 | 350.8 | 442.9 | 559.2 | 706.0 | 891.4 |
| Total Cash, percent | .0 | .0 | .0 | .0 | .0 | .0 | .0 | .0 | .0 | .0 |
| Account Receivables | 47.5 | 66.3 | 69.2 | 42.7 | 80.5 | 116.2 | 146.7 | 185.2 | 233.9 | 295.3 |
| Account Receivables, % | 19.57 | 22.83 | 14.69 | 7.75 | 13.75 | 15.72 | 15.72 | 15.72 | 15.72 | 15.72 |
| Inventories | 1.7 | 1.8 | 2.3 | 2.4 | 2.8 | 4.1 | 5.1 | 6.5 | 8.2 | 10.3 |
| Inventories, % | 0.70486 | 0.62801 | 0.4978 | 0.43557 | 0.47822 | 0.54889 | 0.54889 | 0.54889 | 0.54889 | 0.54889 |
| Accounts Payable | 7.2 | 16.6 | 22.5 | 31.8 | 72.4 | 46.7 | 59.0 | 74.5 | 94.0 | 118.7 |
| Accounts Payable, % | 2.96 | 5.73 | 4.78 | 5.77 | 12.37 | 6.32 | 6.32 | 6.32 | 6.32 | 6.32 |
| Capital Expenditure | -52.5 | -73.8 | -71.1 | -37.8 | -1,353.0 | -249.8 | -315.4 | -398.2 | -502.8 | -634.8 |
| Capital Expenditure, % | -21.61 | -25.41 | -15.08 | -6.86 | -231.08 | -33.79 | -33.79 | -33.79 | -33.79 | -33.79 |
| Tax Rate, % | 15.94 | 15.94 | 15.94 | 15.94 | 15.94 | 15.94 | 15.94 | 15.94 | 15.94 | 15.94 |
| EBITAT | 60.5 | 90.1 | 264.1 | 7.9 | 320.3 | 222.3 | 280.6 | 354.3 | 447.4 | 564.9 |
| Depreciation | ||||||||||
| Changes in Account Receivables | ||||||||||
| Changes in Inventories | ||||||||||
| Changes in Accounts Payable | ||||||||||
| Capital Expenditure | ||||||||||
| UFCF | 16.8 | 49.3 | 236.7 | 53.9 | -455.3 | 133.3 | 228.1 | 288.0 | 363.7 | 459.2 |
| WACC, % | 5.74 | 5.08 | 5.83 | 4.63 | 5.67 | 5.39 | 5.39 | 5.39 | 5.39 | 5.39 |
| PV UFCF | ||||||||||
| SUM PV UFCF | 1,225.9 | |||||||||
| Long Term Growth Rate, % | 0.50 | |||||||||
| Free cash flow (T + 1) | 461 | |||||||||
| Terminal Value | 9,435 | |||||||||
| Present Terminal Value | 7,256 | |||||||||
| Enterprise Value | 8,482 | |||||||||
| Net Debt | 2,500 | |||||||||
| Equity Value | 5,982 | |||||||||
| Diluted Shares Outstanding, MM | 148 | |||||||||
| Equity Value Per Share | 40.38 |
What You Will Receive
- Customizable Excel Template: A fully adjustable Excel-based DCF Calculator featuring pre-filled financial data for Covivio Hotels (COVHPA).
- Accurate Data: Access to historical performance metrics and forward-looking projections (highlighted in the yellow cells).
- Flexible Forecasting: Modify key assumptions such as revenue growth, EBITDA %, and WACC to fit your analysis.
- Instant Calculations: Quickly observe how your inputs affect the valuation of Covivio Hotels (COVHPA).
- Professional-Grade Tool: Designed for use by investors, CFOs, consultants, and financial analysts.
- Intuitive Design: Clearly organized for ease of use, complete with step-by-step guidance.
Key Features
- Real-Life COVHPA Data: Pre-loaded with Covivio Hotels' historical performance metrics and future projections.
- Fully Customizable Inputs: Modify assumptions for revenue growth, profit margins, capital costs, taxation rates, and investment expenditures.
- Dynamic Valuation Model: Instant updates to Net Present Value (NPV) and intrinsic value in response to your adjustments.
- Scenario Testing: Develop various forecasting scenarios to explore different valuation possibilities.
- User-Friendly Design: Clean, organized interface suitable for both industry experts and newcomers.
How It Works
- 1. Access the Template: Download and open the Excel file featuring Covivio Hotels’ (COVHPA) preloaded data.
- 2. Modify Assumptions: Update essential inputs such as growth rates, WACC, and capital expenditures.
- 3. Instantly View Outcomes: The DCF model automatically computes intrinsic value and NPV.
- 4. Experiment with Scenarios: Evaluate various forecasts to explore different valuation results.
- 5. Present with Assurance: Share professional valuation insights to enhance your decision-making.
Why Choose This Calculator for Covivio Hotels (COVHPA)?
- User-Friendly Design: Perfect for both novices and seasoned professionals.
- Customizable Inputs: Adjust assumptions effortlessly to suit your analysis needs.
- Real-Time Valuation: Observe immediate updates to Covivio Hotels’ valuation as you tweak the inputs.
- Preloaded Data: Comes with Covivio Hotels’ actual financial data for swift analysis.
- Relied Upon by Experts: Favored by investors and analysts for making well-informed decisions.
Who Can Benefit from This Product?
- Hospitality Management Students: Discover valuation methods and apply them using real industry data.
- Researchers: Integrate advanced models into your academic projects or studies.
- Investors: Validate your investment strategies and evaluate valuation outcomes for Covivio Hotels (COVHPA).
- Market Analysts: Enhance your efficiency with a customizable DCF model tailored for hotel investments.
- Hotel Owners: Learn about the analytical approaches used for assessing large hotel chains like Covivio Hotels (COVHPA).
Contents of the Template
- Historical Data: Features Covivio Hotels’ previous financial performance and foundational forecasts.
- DCF and Levered DCF Models: Comprehensive templates for assessing the intrinsic value of Covivio Hotels.
- WACC Sheet: Ready-to-use calculations for Weighted Average Cost of Capital.
- Editable Inputs: Adjust critical parameters such as growth rates, EBITDA %, and CAPEX estimates.
- Quarterly and Annual Statements: An in-depth analysis of Covivio Hotels’ financial data.
- Interactive Dashboard: Dynamically visualize valuation outcomes and forecasts.
Disclaimer
All information, articles, and product details provided on this website are for general informational and educational purposes only. We do not claim any ownership over, nor do we intend to infringe upon, any trademarks, copyrights, logos, brand names, or other intellectual property mentioned or depicted on this site. Such intellectual property remains the property of its respective owners, and any references here are made solely for identification or informational purposes, without implying any affiliation, endorsement, or partnership.
We make no representations or warranties, express or implied, regarding the accuracy, completeness, or suitability of any content or products presented. Nothing on this website should be construed as legal, tax, investment, financial, medical, or other professional advice. In addition, no part of this site—including articles or product references—constitutes a solicitation, recommendation, endorsement, advertisement, or offer to buy or sell any securities, franchises, or other financial instruments, particularly in jurisdictions where such activity would be unlawful.
All content is of a general nature and may not address the specific circumstances of any individual or entity. It is not a substitute for professional advice or services. Any actions you take based on the information provided here are strictly at your own risk. You accept full responsibility for any decisions or outcomes arising from your use of this website and agree to release us from any liability in connection with your use of, or reliance upon, the content or products found herein.