
|
Valoración DCF de Central Pacific Financial Corp. (CPF) |
Completamente Editable: Adáptelo A Sus Necesidades En Excel O Sheets
Diseño Profesional: Plantillas Confiables Y Estándares De La Industria
Predeterminadas Para Un Uso Rápido Y Eficiente
Compatible con MAC / PC, completamente desbloqueado
No Se Necesita Experiencia; Fáciles De Seguir
Central Pacific Financial Corp. (CPF) Bundle
¡Obtenga información sobre su análisis de valoración de Central Pacific Financial Corp. (CPF) con nuestra calculadora DCF de vanguardia! Prelabastado con datos de CPF actualizados, esta plantilla de Excel le permite ajustar preventos y supuestos, lo que permite un cálculo preciso del valor intrínseco de Central Pacific Financial Corp.
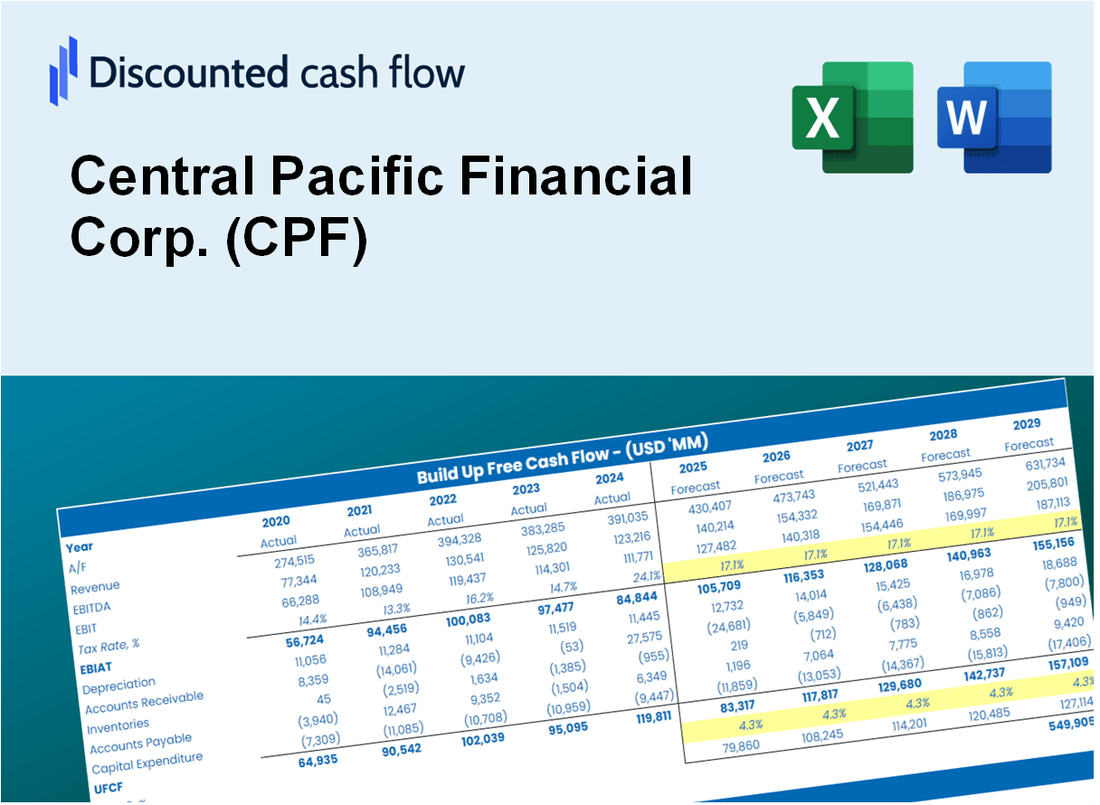
Discounted Cash Flow (DCF) - (USD MM)
| Year | AY1 2020 |
AY2 2021 |
AY3 2022 |
AY4 2023 |
AY5 2024 |
FY1 2025 |
FY2 2026 |
FY3 2027 |
FY4 2028 |
FY5 2029 |
|---|---|---|---|---|---|---|---|---|---|---|
| Revenue | 257.6 | 259.9 | 277.0 | 319.6 | 340.5 | 365.5 | 392.3 | 421.1 | 452.1 | 485.3 |
| Revenue Growth, % | 0 | 0.87068 | 6.61 | 15.37 | 6.52 | 7.34 | 7.34 | 7.34 | 7.34 | 7.34 |
| EBITDA | 61.4 | 116.1 | 106.9 | 84.5 | 77.2 | 114.2 | 122.6 | 131.6 | 141.2 | 151.6 |
| EBITDA, % | 23.84 | 44.68 | 38.6 | 26.43 | 22.66 | 31.24 | 31.24 | 31.24 | 31.24 | 31.24 |
| Depreciation | 12.4 | 10.5 | 8.2 | 7.6 | 9.1 | 12.3 | 13.2 | 14.2 | 15.2 | 16.4 |
| Depreciation, % | 4.81 | 4.02 | 2.95 | 2.39 | 2.68 | 3.37 | 3.37 | 3.37 | 3.37 | 3.37 |
| EBIT | 49.0 | 105.7 | 98.8 | 76.8 | 68.0 | 101.9 | 109.4 | 117.4 | 126.0 | 135.3 |
| EBIT, % | 19.03 | 40.66 | 35.65 | 24.03 | 19.98 | 27.87 | 27.87 | 27.87 | 27.87 | 27.87 |
| Total Cash | 1,286.7 | 1,960.6 | 783.8 | 1,169.6 | 924.8 | 365.5 | 392.3 | 421.1 | 452.1 | 485.3 |
| Total Cash, percent | .0 | .0 | .0 | .0 | .0 | .0 | .0 | .0 | .0 | .0 |
| Account Receivables | 20.2 | 16.7 | 20.3 | 21.5 | 23.4 | 25.7 | 27.6 | 29.7 | 31.8 | 34.2 |
| Account Receivables, % | 7.85 | 6.43 | 7.34 | 6.73 | 6.87 | 7.04 | 7.04 | 7.04 | 7.04 | 7.04 |
| Inventories | .0 | .0 | .0 | .0 | .0 | .0 | .0 | .0 | .0 | .0 |
| Inventories, % | 0 | 0 | 0 | 0 | 0 | 0 | 0 | 0 | 0 | 0 |
| Accounts Payable | .0 | .0 | 4.7 | 18.9 | 10.1 | 7.7 | 8.3 | 8.9 | 9.6 | 10.3 |
| Accounts Payable, % | 0 | 0 | 1.71 | 5.93 | 2.95 | 2.12 | 2.12 | 2.12 | 2.12 | 2.12 |
| Capital Expenditure | -26.0 | -22.2 | -18.4 | -12.7 | -15.1 | -24.6 | -26.4 | -28.4 | -30.4 | -32.7 |
| Capital Expenditure, % | -10.09 | -8.53 | -6.66 | -3.96 | -4.43 | -6.73 | -6.73 | -6.73 | -6.73 | -6.73 |
| Tax Rate, % | 21.5 | 21.5 | 21.5 | 21.5 | 21.5 | 21.5 | 21.5 | 21.5 | 21.5 | 21.5 |
| EBITAT | 37.3 | 79.9 | 73.9 | 58.7 | 53.4 | 77.7 | 83.4 | 89.5 | 96.1 | 103.2 |
| Depreciation | ||||||||||
| Changes in Account Receivables | ||||||||||
| Changes in Inventories | ||||||||||
| Changes in Accounts Payable | ||||||||||
| Capital Expenditure | ||||||||||
| UFCF | 3.4 | 71.7 | 64.8 | 66.7 | 36.7 | 60.7 | 68.9 | 73.9 | 79.4 | 85.2 |
| WACC, % | 14 | 13.96 | 13.89 | 14.03 | 14.23 | 14.02 | 14.02 | 14.02 | 14.02 | 14.02 |
| PV UFCF | ||||||||||
| SUM PV UFCF | 247.3 | |||||||||
| Long Term Growth Rate, % | 2.00 | |||||||||
| Free cash flow (T + 1) | 87 | |||||||||
| Terminal Value | 723 | |||||||||
| Present Terminal Value | 375 | |||||||||
| Enterprise Value | 622 | |||||||||
| Net Debt | -193 | |||||||||
| Equity Value | 815 | |||||||||
| Diluted Shares Outstanding, MM | 27 | |||||||||
| Equity Value Per Share | 29.97 |
What You Will Get
- Real CPF Financials: Access to historical and projected data for precise valuation.
- Customizable Inputs: Adjust WACC, tax rates, revenue growth, and capital expenditures as needed.
- Dynamic Calculations: Intrinsic value and NPV are computed in real-time.
- Scenario Analysis: Explore various scenarios to assess Central Pacific Financial Corp.'s future performance.
- User-Friendly Interface: Designed for professionals while remaining approachable for newcomers.
Key Features
- Pre-Loaded Data: Central Pacific Financial Corp.'s (CPF) historical financial statements and pre-filled forecasts.
- Fully Adjustable Inputs: Customize WACC, tax rates, revenue growth, and EBITDA margins.
- Instant Results: View Central Pacific Financial Corp.'s (CPF) intrinsic value recalculating in real time.
- Clear Visual Outputs: Dashboard charts illustrate valuation results and key metrics.
- Built for Accuracy: A professional tool tailored for analysts, investors, and finance experts.
How It Works
- Step 1: Download the prebuilt Excel template featuring Central Pacific Financial Corp.'s (CPF) data.
- Step 2: Navigate through the pre-filled sheets to familiarize yourself with the essential metrics.
- Step 3: Modify forecasts and assumptions in the editable yellow cells (WACC, growth, margins).
- Step 4: Instantly observe the recalculated results, including Central Pacific Financial Corp.'s (CPF) intrinsic value.
- Step 5: Make well-informed investment decisions or create reports based on the outputs.
Why Choose This Calculator for Central Pacific Financial Corp. (CPF)?
- Accurate Data: Utilize real Central Pacific Financial Corp. (CPF) financials for dependable valuation outcomes.
- Customizable: Tailor essential parameters such as growth rates, WACC, and tax rates to fit your forecasts.
- Time-Saving: Built-in calculations save you from starting from the ground up.
- Professional-Grade Tool: Crafted for investors, analysts, and financial consultants.
- User-Friendly: Clear layout and guided instructions ensure accessibility for all users.
Who Should Use This Product?
- Investors: Assess Central Pacific Financial Corp.'s (CPF) valuation before making investment decisions.
- CFOs and Financial Analysts: Optimize valuation methods and evaluate financial forecasts.
- Startup Founders: Understand the valuation processes of established financial institutions like Central Pacific Financial Corp. (CPF).
- Consultants: Create comprehensive valuation reports for your clients based on Central Pacific Financial Corp. (CPF).
- Students and Educators: Utilize real-time data from Central Pacific Financial Corp. (CPF) to learn and teach valuation strategies.
What the Template Contains
- Operating and Balance Sheet Data: Pre-filled Central Pacific Financial Corp. (CPF) historical data and forecasts, including revenue, EBITDA, EBIT, and capital expenditures.
- WACC Calculation: A dedicated sheet for Weighted Average Cost of Capital (WACC), including parameters like Beta, risk-free rate, and share price.
- DCF Valuation (Unlevered and Levered): Editable Discounted Cash Flow models showing intrinsic value with detailed calculations.
- Financial Statements: Pre-loaded financial statements (annual and quarterly) to support analysis.
- Key Ratios: Includes profitability, leverage, and efficiency ratios for Central Pacific Financial Corp. (CPF).
- Dashboard and Charts: Visual summary of valuation outputs and assumptions to analyze results easily.
Disclaimer
All information, articles, and product details provided on this website are for general informational and educational purposes only. We do not claim any ownership over, nor do we intend to infringe upon, any trademarks, copyrights, logos, brand names, or other intellectual property mentioned or depicted on this site. Such intellectual property remains the property of its respective owners, and any references here are made solely for identification or informational purposes, without implying any affiliation, endorsement, or partnership.
We make no representations or warranties, express or implied, regarding the accuracy, completeness, or suitability of any content or products presented. Nothing on this website should be construed as legal, tax, investment, financial, medical, or other professional advice. In addition, no part of this site—including articles or product references—constitutes a solicitation, recommendation, endorsement, advertisement, or offer to buy or sell any securities, franchises, or other financial instruments, particularly in jurisdictions where such activity would be unlawful.
All content is of a general nature and may not address the specific circumstances of any individual or entity. It is not a substitute for professional advice or services. Any actions you take based on the information provided here are strictly at your own risk. You accept full responsibility for any decisions or outcomes arising from your use of this website and agree to release us from any liability in connection with your use of, or reliance upon, the content or products found herein.