
|
Valoración DCF de Capri Holdings Limited (CPRI) |
Completamente Editable: Adáptelo A Sus Necesidades En Excel O Sheets
Diseño Profesional: Plantillas Confiables Y Estándares De La Industria
Predeterminadas Para Un Uso Rápido Y Eficiente
Compatible con MAC / PC, completamente desbloqueado
No Se Necesita Experiencia; Fáciles De Seguir
Capri Holdings Limited (CPRI) Bundle
¡Descubra el verdadero valor de Capri Holdings Limited con nuestra calculadora DCF de grado profesional! Ajuste los supuestos clave, pruebe varios escenarios y examine cómo los cambios afectan la valoración de Capri Holdings Limited, todo dentro de una sola plantilla de Excel.
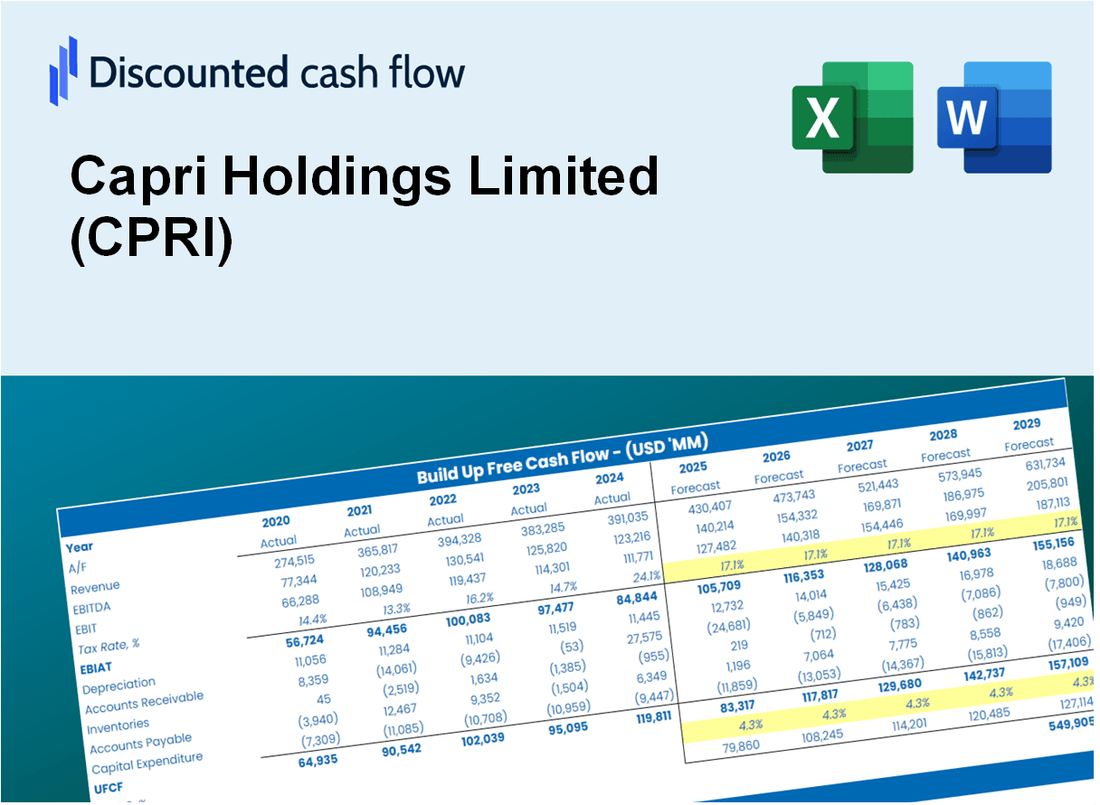
Discounted Cash Flow (DCF) - (USD MM)
| Year | AY1 2021 |
AY2 2022 |
AY3 2023 |
AY4 2024 |
AY5 2025 |
FY1 2026 |
FY2 2027 |
FY3 2028 |
FY4 2029 |
FY5 2030 |
|---|---|---|---|---|---|---|---|---|---|---|
| Revenue | 5,654.0 | 5,619.0 | 5,170.0 | 4,442.0 | 4,442.0 | 4,190.0 | 3,952.3 | 3,728.1 | 3,516.6 | 3,317.1 |
| Revenue Growth, % | 0 | -0.61903 | -7.99 | -14.08 | 0 | -5.67 | -5.67 | -5.67 | -5.67 | -5.67 |
| EBITDA | 1,211.0 | 1,016.0 | 555.0 | 245.0 | 245.0 | 513.4 | 484.3 | 456.8 | 430.9 | 406.5 |
| EBITDA, % | 21.42 | 18.08 | 10.74 | 5.52 | 5.52 | 12.25 | 12.25 | 12.25 | 12.25 | 12.25 |
| Depreciation | 193.0 | 179.0 | 188.0 | 193.0 | 193.0 | 158.6 | 149.6 | 141.1 | 133.1 | 125.6 |
| Depreciation, % | 3.41 | 3.19 | 3.64 | 4.34 | 4.34 | 3.79 | 3.79 | 3.79 | 3.79 | 3.79 |
| EBIT | 1,018.0 | 837.0 | 367.0 | 52.0 | 52.0 | 354.8 | 334.7 | 315.7 | 297.8 | 280.9 |
| EBIT, % | 18 | 14.9 | 7.1 | 1.17 | 1.17 | 8.47 | 8.47 | 8.47 | 8.47 | 8.47 |
| Total Cash | 232.0 | 169.0 | 249.0 | 199.0 | 166.0 | 168.8 | 159.2 | 150.2 | 141.7 | 133.6 |
| Total Cash, percent | .0 | .0 | .0 | .0 | .0 | .0 | .0 | .0 | .0 | .0 |
| Account Receivables | 398.0 | 464.0 | 389.0 | 382.0 | 321.0 | 323.9 | 305.5 | 288.2 | 271.8 | 256.4 |
| Account Receivables, % | 7.04 | 8.26 | 7.52 | 8.6 | 7.23 | 7.73 | 7.73 | 7.73 | 7.73 | 7.73 |
| Inventories | 736.0 | 1,096.0 | 1,057.0 | 862.0 | 869.0 | 770.4 | 726.7 | 685.5 | 646.6 | 609.9 |
| Inventories, % | 13.02 | 19.51 | 20.44 | 19.41 | 19.56 | 18.39 | 18.39 | 18.39 | 18.39 | 18.39 |
| Accounts Payable | 512.0 | 555.0 | 475.0 | 352.0 | 485.0 | 393.6 | 371.2 | 350.2 | 330.3 | 311.6 |
| Accounts Payable, % | 9.06 | 9.88 | 9.19 | 7.92 | 10.92 | 9.39 | 9.39 | 9.39 | 9.39 | 9.39 |
| Capital Expenditure | -111.0 | -131.0 | -226.0 | -189.0 | -128.0 | -132.4 | -124.9 | -117.8 | -111.1 | -104.8 |
| Capital Expenditure, % | -1.96 | -2.33 | -4.37 | -4.25 | -2.88 | -3.16 | -3.16 | -3.16 | -3.16 | -3.16 |
| Tax Rate, % | -62.59 | -62.59 | -62.59 | -62.59 | -62.59 | -62.59 | -62.59 | -62.59 | -62.59 | -62.59 |
| EBITAT | 914.5 | 795.7 | 297.0 | 84.5 | 84.5 | 330.6 | 311.8 | 294.1 | 277.4 | 261.7 |
| Depreciation | ||||||||||
| Changes in Account Receivables | ||||||||||
| Changes in Inventories | ||||||||||
| Changes in Accounts Payable | ||||||||||
| Capital Expenditure | ||||||||||
| UFCF | 374.5 | 460.7 | 293.0 | 167.5 | 336.5 | 361.0 | 376.2 | 354.9 | 334.8 | 315.8 |
| WACC, % | 6.73 | 6.84 | 6.55 | 6.94 | 6.94 | 6.8 | 6.8 | 6.8 | 6.8 | 6.8 |
| PV UFCF | ||||||||||
| SUM PV UFCF | 1,443.8 | |||||||||
| Long Term Growth Rate, % | 3.00 | |||||||||
| Free cash flow (T + 1) | 325 | |||||||||
| Terminal Value | 8,563 | |||||||||
| Present Terminal Value | 6,163 | |||||||||
| Enterprise Value | 7,607 | |||||||||
| Net Debt | 2,937 | |||||||||
| Equity Value | 4,670 | |||||||||
| Diluted Shares Outstanding, MM | 118 | |||||||||
| Equity Value Per Share | 39.49 |
What You Will Gain
- Customizable Excel Template: A fully adjustable Excel-based DCF Calculator featuring pre-filled financial data for Capri Holdings Limited (CPRI).
- Authentic Data: Access to historical performance and projected estimates (highlighted in the yellow cells).
- Flexible Forecasting: Modify key assumptions such as revenue growth, EBITDA %, and WACC.
- Instant Calculations: Quickly observe how your inputs affect the valuation of Capri Holdings Limited (CPRI).
- Professional Resource: Designed for investors, CFOs, consultants, and financial analysts.
- Intuitive Layout: Organized for simplicity and ease of navigation, complete with step-by-step guidance.
Key Features
- Real-Life CPRI Data: Pre-filled with Capri Holdings' historical financials and future projections.
- Fully Customizable Inputs: Modify revenue growth, profit margins, discount rates, tax rates, and capital expenditures.
- Dynamic Valuation Model: Instant updates to Net Present Value (NPV) and intrinsic value based on your inputs.
- Scenario Testing: Generate multiple forecasting scenarios to evaluate various valuation outcomes.
- User-Friendly Design: Intuitive, organized, and crafted for both professionals and novices.
How It Works
- Step 1: Download the Excel file.
- Step 2: Review pre-entered Capri Holdings Limited (CPRI) data (historical and projected).
- Step 3: Adjust key assumptions (yellow cells) based on your analysis.
- Step 4: View automatic recalculations for Capri Holdings Limited’s intrinsic value.
- Step 5: Use the outputs for investment decisions or reporting.
Why Choose This Calculator for Capri Holdings Limited (CPRI)?
- Accuracy: Utilizes authentic Capri Holdings financial data for precise calculations.
- Flexibility: Built for users to easily test and adjust inputs as needed.
- Time-Saving: Eliminate the complexities of constructing a DCF model from the ground up.
- Professional-Grade: Crafted with the expertise and functionality expected at the CFO level.
- User-Friendly: Intuitive interface designed for users of all financial backgrounds.
Who Should Use This Product?
- Individual Investors: Make informed decisions about buying or selling Capri Holdings Limited (CPRI) stock.
- Financial Analysts: Streamline valuation processes with ready-to-use financial models for Capri Holdings Limited (CPRI).
- Consultants: Deliver professional valuation insights on Capri Holdings Limited (CPRI) to clients quickly and accurately.
- Business Owners: Understand how large companies like Capri Holdings Limited (CPRI) are valued to guide your own strategy.
- Finance Students: Learn valuation techniques using real-world data and scenarios related to Capri Holdings Limited (CPRI).
What the Capri Holdings Template Contains
- Comprehensive DCF Model: Editable template with detailed valuation calculations for Capri Holdings Limited.
- Real-World Data: Capri Holdings’ historical and projected financials preloaded for analysis.
- Customizable Parameters: Adjust WACC, growth rates, and tax assumptions to test various scenarios.
- Financial Statements: Full annual and quarterly breakdowns for deeper insights into performance.
- Key Ratios: Built-in analysis for profitability, efficiency, and leverage metrics.
- Dashboard with Visual Outputs: Charts and tables for clear, actionable results tailored to Capri Holdings Limited (CPRI).
Disclaimer
All information, articles, and product details provided on this website are for general informational and educational purposes only. We do not claim any ownership over, nor do we intend to infringe upon, any trademarks, copyrights, logos, brand names, or other intellectual property mentioned or depicted on this site. Such intellectual property remains the property of its respective owners, and any references here are made solely for identification or informational purposes, without implying any affiliation, endorsement, or partnership.
We make no representations or warranties, express or implied, regarding the accuracy, completeness, or suitability of any content or products presented. Nothing on this website should be construed as legal, tax, investment, financial, medical, or other professional advice. In addition, no part of this site—including articles or product references—constitutes a solicitation, recommendation, endorsement, advertisement, or offer to buy or sell any securities, franchises, or other financial instruments, particularly in jurisdictions where such activity would be unlawful.
All content is of a general nature and may not address the specific circumstances of any individual or entity. It is not a substitute for professional advice or services. Any actions you take based on the information provided here are strictly at your own risk. You accept full responsibility for any decisions or outcomes arising from your use of this website and agree to release us from any liability in connection with your use of, or reliance upon, the content or products found herein.