
|
Valoración DCF de Champions Oncology, Inc. (CSBR) |
Completamente Editable: Adáptelo A Sus Necesidades En Excel O Sheets
Diseño Profesional: Plantillas Confiables Y Estándares De La Industria
Predeterminadas Para Un Uso Rápido Y Eficiente
Compatible con MAC / PC, completamente desbloqueado
No Se Necesita Experiencia; Fáciles De Seguir
Champions Oncology, Inc. (CSBR) Bundle
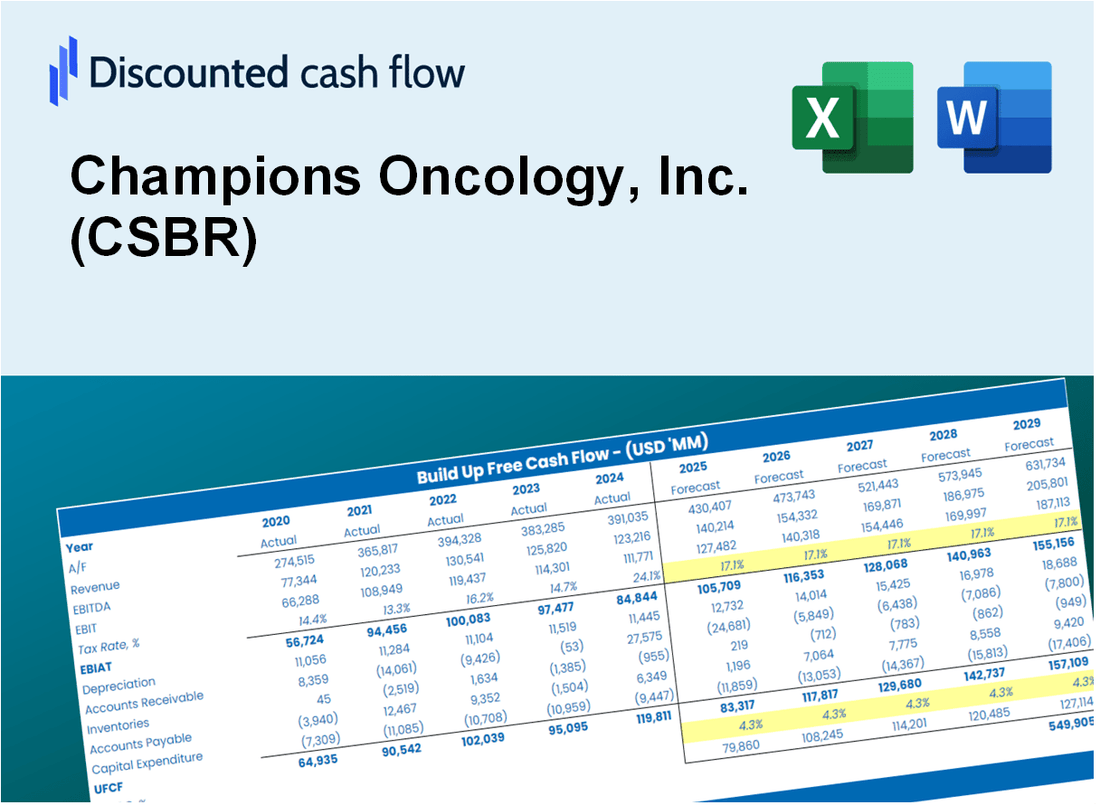
Si es un inversor o analista, la calculadora DCF de Champions Oncology, Inc. (CSBR) es la herramienta perfecta para una valoración precisa. Cargados con datos reales de la oncología de Champions, puede ajustar previsiones y observar los efectos en tiempo real.
Discounted Cash Flow (DCF) - (USD MM)
| Year | AY1 2021 |
AY2 2022 |
AY3 2023 |
AY4 2024 |
AY5 2025 |
FY1 2026 |
FY2 2027 |
FY3 2028 |
FY4 2029 |
FY5 2030 |
|---|---|---|---|---|---|---|---|---|---|---|
| Revenue | 41.0 | 49.1 | 53.9 | 50.2 | 56.9 | 62.1 | 67.7 | 73.7 | 80.4 | 87.6 |
| Revenue Growth, % | 0 | 19.66 | 9.69 | -6.9 | 13.54 | 9 | 9 | 9 | 9 | 9 |
| EBITDA | .4 | 2.2 | -2.1 | -5.1 | 6.5 | .4 | .4 | .4 | .5 | .5 |
| EBITDA, % | 0.89181 | 4.55 | -3.84 | -10.08 | 11.39 | 0.58271 | 0.58271 | 0.58271 | 0.58271 | 0.58271 |
| Depreciation | 1.6 | 2.4 | 3.2 | 1.9 | 1.6 | 2.6 | 2.9 | 3.1 | 3.4 | 3.7 |
| Depreciation, % | 3.85 | 4.91 | 5.94 | 3.72 | 2.88 | 4.26 | 4.26 | 4.26 | 4.26 | 4.26 |
| EBIT | -1.2 | -.2 | -5.3 | -6.9 | 4.8 | -2.3 | -2.5 | -2.7 | -3.0 | -3.2 |
| EBIT, % | -2.96 | -0.3645 | -9.78 | -13.8 | 8.51 | -3.68 | -3.68 | -3.68 | -3.68 | -3.68 |
| Total Cash | 4.7 | 9.0 | 10.1 | 2.6 | 9.8 | 8.8 | 9.6 | 10.5 | 11.4 | 12.4 |
| Total Cash, percent | .0 | .0 | .0 | .0 | .0 | .0 | .0 | .0 | .0 | .0 |
| Account Receivables | 7.0 | 9.5 | 8.0 | 9.5 | 11.2 | 11.2 | 12.2 | 13.3 | 14.5 | 15.8 |
| Account Receivables, % | 17.02 | 19.37 | 14.87 | 18.99 | 19.73 | 18 | 18 | 18 | 18 | 18 |
| Inventories | .0 | .0 | .0 | .0 | .0 | .0 | .0 | .0 | .0 | .0 |
| Inventories, % | 0 | 0 | 0 | 0 | 0 | 0 | 0 | 0 | 0 | 0 |
| Accounts Payable | 1.9 | 2.9 | 5.3 | 5.8 | 4.2 | 4.9 | 5.3 | 5.8 | 6.3 | 6.9 |
| Accounts Payable, % | 4.62 | 5.84 | 9.9 | 11.56 | 7.46 | 7.88 | 7.88 | 7.88 | 7.88 | 7.88 |
| Capital Expenditure | -3.3 | -2.4 | -2.9 | -.8 | -.4 | -2.5 | -2.8 | -3.0 | -3.3 | -3.6 |
| Capital Expenditure, % | -7.99 | -4.85 | -5.33 | -1.67 | -0.68313 | -4.11 | -4.11 | -4.11 | -4.11 | -4.11 |
| Tax Rate, % | -1.62 | -1.62 | -1.62 | -1.62 | -1.62 | -1.62 | -1.62 | -1.62 | -1.62 | -1.62 |
| EBITAT | -1.0 | -.2 | -5.3 | -6.9 | 4.9 | -2.2 | -2.4 | -2.6 | -2.8 | -3.1 |
| Depreciation | ||||||||||
| Changes in Account Receivables | ||||||||||
| Changes in Inventories | ||||||||||
| Changes in Accounts Payable | ||||||||||
| Capital Expenditure | ||||||||||
| UFCF | -7.8 | -1.7 | -1.0 | -6.9 | 2.9 | -1.4 | -2.8 | -3.1 | -3.4 | -3.7 |
| WACC, % | 5.23 | 5.25 | 5.26 | 5.26 | 5.26 | 5.25 | 5.25 | 5.25 | 5.25 | 5.25 |
| PV UFCF | ||||||||||
| SUM PV UFCF | -12.1 | |||||||||
| Long Term Growth Rate, % | 2.00 | |||||||||
| Free cash flow (T + 1) | -4 | |||||||||
| Terminal Value | -115 | |||||||||
| Present Terminal Value | -89 | |||||||||
| Enterprise Value | -101 | |||||||||
| Net Debt | -4 | |||||||||
| Equity Value | -97 | |||||||||
| Diluted Shares Outstanding, MM | 14 | |||||||||
| Equity Value Per Share | -6.83 |
What You Will Get
- Real Champions Oncology Data: Preloaded financials – from revenue to EBIT – based on actual and projected figures for Champions Oncology, Inc. (CSBR).
- Full Customization: Adjust all critical parameters (yellow cells) like WACC, growth %, and tax rates specific to Champions Oncology.
- Instant Valuation Updates: Automatic recalculations to analyze the impact of changes on Champions Oncology’s fair value.
- Versatile Excel Template: Tailored for quick edits, scenario testing, and detailed projections for Champions Oncology, Inc. (CSBR).
- Time-Saving and Accurate: Skip building models from scratch while maintaining precision and flexibility for Champions Oncology.
Key Features
- Real-Time CSBR Data: Pre-filled with Champions Oncology's historical performance metrics and future growth estimates.
- Completely Adjustable Inputs: Modify revenue projections, profit margins, discount rates, tax implications, and capital investments.
- Interactive Valuation Model: Instant updates to Net Present Value (NPV) and intrinsic value based on your customized inputs.
- Scenario Analysis: Develop various forecasting scenarios to evaluate different valuation possibilities.
- Intuitive User Interface: Clear, organized, and crafted for both seasoned professionals and newcomers.
How It Works
- Step 1: Download the prebuilt Excel template featuring Champions Oncology, Inc.'s (CSBR) data.
- Step 2: Navigate through the pre-filled sheets to familiarize yourself with the essential metrics.
- Step 3: Modify forecasts and assumptions in the editable yellow cells (WACC, growth, margins).
- Step 4: Instantly see the updated results, including the intrinsic value of Champions Oncology, Inc. (CSBR).
- Step 5: Make well-informed investment choices or create reports based on the outputs.
Why Choose This Calculator for Champions Oncology, Inc. (CSBR)?
- Accurate Data: Up-to-date Champions Oncology financials provide trustworthy valuation outcomes.
- Customizable: Tailor essential parameters like growth rates, WACC, and tax rates to align with your forecasts.
- Time-Saving: Pre-configured calculations save you the hassle of starting from the ground up.
- Professional-Grade Tool: Crafted for investors, analysts, and consultants focusing on Champions Oncology.
- User-Friendly: Easy-to-navigate design and clear instructions make it accessible for everyone.
Who Should Use This Product?
- Individual Investors: Make informed decisions about buying or selling Champions Oncology, Inc. (CSBR) stock.
- Financial Analysts: Streamline valuation processes with ready-to-use financial models for Champions Oncology, Inc. (CSBR).
- Consultants: Deliver professional valuation insights on Champions Oncology, Inc. (CSBR) to clients quickly and accurately.
- Business Owners: Understand how biotech companies like Champions Oncology, Inc. (CSBR) are valued to guide your own strategy.
- Finance Students: Learn valuation techniques using real-world data and scenarios related to Champions Oncology, Inc. (CSBR).
What the Template Contains
- Preloaded CSBR Data: Historical and projected financial data, including revenue, EBIT, and capital expenditures.
- DCF and WACC Models: Professional-grade sheets for calculating intrinsic value and Weighted Average Cost of Capital.
- Editable Inputs: Yellow-highlighted cells for adjusting revenue growth, tax rates, and discount rates.
- Financial Statements: Comprehensive annual and quarterly financials for deeper analysis.
- Key Ratios: Profitability, leverage, and efficiency ratios to evaluate performance.
- Dashboard and Charts: Visual summaries of valuation outcomes and assumptions.
Disclaimer
All information, articles, and product details provided on this website are for general informational and educational purposes only. We do not claim any ownership over, nor do we intend to infringe upon, any trademarks, copyrights, logos, brand names, or other intellectual property mentioned or depicted on this site. Such intellectual property remains the property of its respective owners, and any references here are made solely for identification or informational purposes, without implying any affiliation, endorsement, or partnership.
We make no representations or warranties, express or implied, regarding the accuracy, completeness, or suitability of any content or products presented. Nothing on this website should be construed as legal, tax, investment, financial, medical, or other professional advice. In addition, no part of this site—including articles or product references—constitutes a solicitation, recommendation, endorsement, advertisement, or offer to buy or sell any securities, franchises, or other financial instruments, particularly in jurisdictions where such activity would be unlawful.
All content is of a general nature and may not address the specific circumstances of any individual or entity. It is not a substitute for professional advice or services. Any actions you take based on the information provided here are strictly at your own risk. You accept full responsibility for any decisions or outcomes arising from your use of this website and agree to release us from any liability in connection with your use of, or reliance upon, the content or products found herein.