
|
Valoración DCF de CTO Realty Growth, Inc. (CTO) |
Completamente Editable: Adáptelo A Sus Necesidades En Excel O Sheets
Diseño Profesional: Plantillas Confiables Y Estándares De La Industria
Predeterminadas Para Un Uso Rápido Y Eficiente
Compatible con MAC / PC, completamente desbloqueado
No Se Necesita Experiencia; Fáciles De Seguir
CTO Realty Growth, Inc. (CTO) Bundle
¡Simplifique la valoración de CTO Realty Growth, Inc. (CTO) con esta calculadora DCF personalizable! Con las finanzas de CTO reales y las entradas de pronóstico ajustables, puede probar escenarios y descubrir el valor razonable de CTO en minutos.
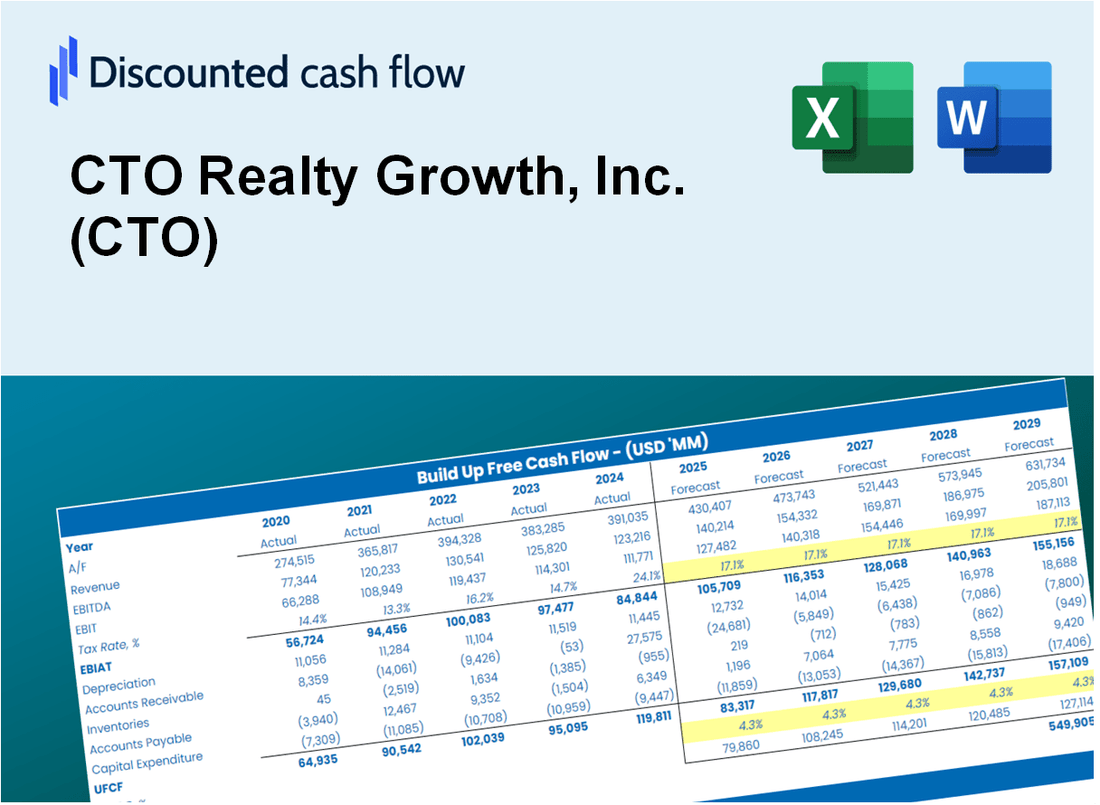
Discounted Cash Flow (DCF) - (USD MM)
| Year | AY1 2020 |
AY2 2021 |
AY3 2022 |
AY4 2023 |
AY5 2024 |
FY1 2025 |
FY2 2026 |
FY3 2027 |
FY4 2028 |
FY5 2029 |
|---|---|---|---|---|---|---|---|---|---|---|
| Revenue | 56.4 | 70.3 | 82.3 | 109.1 | 124.5 | 152.1 | 185.7 | 226.7 | 276.9 | 338.1 |
| Revenue Growth, % | 0 | 24.64 | 17.14 | 32.55 | 14.11 | 22.11 | 22.11 | 22.11 | 22.11 | 22.11 |
| EBITDA | 29.6 | 36.6 | 46.6 | 71.7 | 75.0 | 87.3 | 106.6 | 130.2 | 159.0 | 194.2 |
| EBITDA, % | 52.51 | 52.14 | 56.56 | 65.7 | 60.25 | 57.43 | 57.43 | 57.43 | 57.43 | 57.43 |
| Depreciation | 19.1 | 20.6 | 28.9 | 44.2 | 65.0 | 58.0 | 70.9 | 86.6 | 105.7 | 129.1 |
| Depreciation, % | 33.81 | 29.29 | 35.05 | 40.48 | 52.24 | 38.17 | 38.17 | 38.17 | 38.17 | 38.17 |
| EBIT | 10.5 | 16.1 | 17.7 | 27.5 | 10.0 | 29.3 | 35.8 | 43.7 | 53.3 | 65.1 |
| EBIT, % | 18.69 | 22.85 | 21.51 | 25.22 | 8.01 | 19.26 | 19.26 | 19.26 | 19.26 | 19.26 |
| Total Cash | 34.9 | 49.7 | 61.4 | 49.7 | 48.7 | 88.7 | 108.3 | 132.3 | 161.5 | 197.2 |
| Total Cash, percent | .0 | .0 | .0 | .0 | .0 | .0 | .0 | .0 | .0 | .0 |
| Account Receivables | 47.4 | 48.3 | 8.4 | 15.5 | 125.7 | 84.3 | 103.0 | 125.7 | 153.5 | 187.5 |
| Account Receivables, % | 84.01 | 68.78 | 10.23 | 14.24 | 100.92 | 55.45 | 55.45 | 55.45 | 55.45 | 55.45 |
| Inventories | 28.7 | 25.9 | -5.4 | .7 | .3 | 25.0 | 30.5 | 37.2 | 45.5 | 55.5 |
| Inventories, % | 50.86 | 36.9 | -6.59 | 0.66991 | 0.24093 | 16.42 | 16.42 | 16.42 | 16.42 | 16.42 |
| Accounts Payable | 1.0 | .7 | 2.5 | 2.8 | 3.3 | 3.4 | 4.1 | 5.0 | 6.1 | 7.5 |
| Accounts Payable, % | 1.86 | 0.96198 | 3.09 | 2.53 | 2.63 | 2.21 | 2.21 | 2.21 | 2.21 | 2.21 |
| Capital Expenditure | -167.8 | -256.4 | -313.9 | -102.9 | -17.5 | -124.2 | -151.7 | -185.2 | -226.1 | -276.2 |
| Capital Expenditure, % | -297.64 | -364.84 | -381.35 | -94.35 | -14.05 | -81.68 | -81.68 | -81.68 | -81.68 | -81.68 |
| Tax Rate, % | 14.71 | 14.71 | 14.71 | 14.71 | 14.71 | 14.71 | 14.71 | 14.71 | 14.71 | 14.71 |
| EBITAT | -165.8 | 17.9 | 170.5 | 24.8 | 8.5 | 22.0 | 26.9 | 32.8 | 40.0 | 48.9 |
| Depreciation | ||||||||||
| Changes in Account Receivables | ||||||||||
| Changes in Inventories | ||||||||||
| Changes in Accounts Payable | ||||||||||
| Capital Expenditure | ||||||||||
| UFCF | -389.6 | -216.5 | -41.4 | -47.0 | -53.1 | -27.4 | -77.3 | -94.4 | -115.3 | -140.8 |
| WACC, % | 3.14 | 5.33 | 5.33 | 5.12 | 5.01 | 4.79 | 4.79 | 4.79 | 4.79 | 4.79 |
| PV UFCF | ||||||||||
| SUM PV UFCF | -385.8 | |||||||||
| Long Term Growth Rate, % | 2.00 | |||||||||
| Free cash flow (T + 1) | -144 | |||||||||
| Terminal Value | -5,158 | |||||||||
| Present Terminal Value | -4,083 | |||||||||
| Enterprise Value | -4,469 | |||||||||
| Net Debt | 525 | |||||||||
| Equity Value | -4,994 | |||||||||
| Diluted Shares Outstanding, MM | 25 | |||||||||
| Equity Value Per Share | -196.61 |
What You Will Get
- Editable Excel Template: A fully customizable Excel-based DCF Calculator featuring pre-filled real CTO financials.
- Real-World Data: Historical data and forward-looking estimates (as highlighted in the yellow cells).
- Forecast Flexibility: Adjust forecast assumptions such as revenue growth, EBITDA %, and WACC.
- Automatic Calculations: Instantly view the effects of your inputs on CTO’s valuation.
- Professional Tool: Designed for investors, CFOs, consultants, and financial analysts.
- User-Friendly Design: Organized for clarity and ease of use, complete with step-by-step instructions.
Key Features
- Comprehensive Financial Data: Gain access to reliable pre-loaded historical figures and future forecasts for CTO Realty Growth, Inc. (CTO).
- Adjustable Projection Parameters: Modify highlighted cells for metrics such as WACC, growth rates, and profit margins.
- Real-Time Calculations: Instant updates for DCF, Net Present Value (NPV), and cash flow assessments.
- User-Friendly Dashboard: Clear and concise charts and summaries to help visualize your valuation outcomes.
- Designed for All Skill Levels: An accessible and straightforward layout tailored for investors, CFOs, and consultants alike.
How It Works
- Step 1: Download the Excel file.
- Step 2: Review pre-entered CTO Realty Growth, Inc. (CTO) data (historical and projected).
- Step 3: Adjust key assumptions (yellow cells) based on your analysis.
- Step 4: View automatic recalculations for CTO Realty Growth, Inc. (CTO)’s intrinsic value.
- Step 5: Use the outputs for investment decisions or reporting.
Why Choose CTO Realty Growth, Inc. (CTO)?
- Streamlined Process: Access ready-to-use tools without the hassle of building from the ground up.
- Enhanced Precision: Dependable financial insights and methodologies minimize valuation inaccuracies.
- Fully Adaptable: Customize the approach to align with your unique forecasts and assumptions.
- User-Friendly Interface: Intuitive visuals and outputs simplify the analysis of results.
- Preferred by Professionals: Crafted for industry experts who prioritize accuracy and functionality.
Who Should Use This Product?
- Individual Investors: Gain insights to make informed decisions about buying or selling CTO Realty Growth, Inc. (CTO) stock.
- Financial Analysts: Enhance valuation processes with comprehensive financial models tailored for CTO Realty Growth, Inc. (CTO).
- Consultants: Provide clients with accurate and timely valuation insights regarding CTO Realty Growth, Inc. (CTO).
- Real Estate Professionals: Understand the valuation of real estate investment trusts like CTO Realty Growth, Inc. (CTO) to inform your strategies.
- Finance Students: Explore valuation techniques using real-world data from CTO Realty Growth, Inc. (CTO) and similar entities.
What the Template Contains
- Pre-Filled Data: Includes CTO Realty Growth, Inc.'s historical financials and forecasts.
- Discounted Cash Flow Model: Editable DCF valuation model with automatic calculations.
- Weighted Average Cost of Capital (WACC): A dedicated sheet for calculating WACC based on custom inputs.
- Key Financial Ratios: Analyze CTO Realty Growth, Inc.'s profitability, efficiency, and leverage.
- Customizable Inputs: Edit revenue growth, margins, and tax rates with ease.
- Clear Dashboard: Charts and tables summarizing key valuation results.
Disclaimer
All information, articles, and product details provided on this website are for general informational and educational purposes only. We do not claim any ownership over, nor do we intend to infringe upon, any trademarks, copyrights, logos, brand names, or other intellectual property mentioned or depicted on this site. Such intellectual property remains the property of its respective owners, and any references here are made solely for identification or informational purposes, without implying any affiliation, endorsement, or partnership.
We make no representations or warranties, express or implied, regarding the accuracy, completeness, or suitability of any content or products presented. Nothing on this website should be construed as legal, tax, investment, financial, medical, or other professional advice. In addition, no part of this site—including articles or product references—constitutes a solicitation, recommendation, endorsement, advertisement, or offer to buy or sell any securities, franchises, or other financial instruments, particularly in jurisdictions where such activity would be unlawful.
All content is of a general nature and may not address the specific circumstances of any individual or entity. It is not a substitute for professional advice or services. Any actions you take based on the information provided here are strictly at your own risk. You accept full responsibility for any decisions or outcomes arising from your use of this website and agree to release us from any liability in connection with your use of, or reliance upon, the content or products found herein.