
|
Centuri Holdings, Inc. (CTRI) Valoración de DCF |
Completamente Editable: Adáptelo A Sus Necesidades En Excel O Sheets
Diseño Profesional: Plantillas Confiables Y Estándares De La Industria
Predeterminadas Para Un Uso Rápido Y Eficiente
Compatible con MAC / PC, completamente desbloqueado
No Se Necesita Experiencia; Fáciles De Seguir
Centuri Holdings, Inc. (CTRI) Bundle
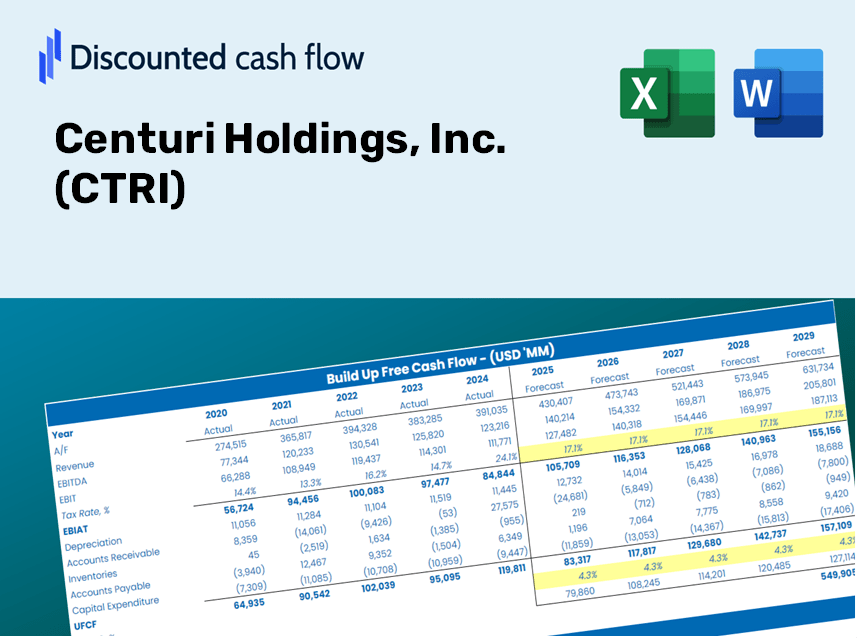
Como inversor o analista, esta calculadora DCF (CTRI) es su recurso de referencia para una valoración precisa. Cargados con datos reales de Centuri Holdings, Inc., puede ajustar fácilmente los pronósticos y observar los efectos en tiempo real.
What You Will Receive
- Customizable Excel Template: A fully adjustable Excel-based DCF Calculator featuring pre-filled financial data for Centuri Holdings, Inc. (CTRI).
- Up-to-Date Data: Access to historical figures and forward-looking projections (highlighted in the yellow cells).
- Adjustable Forecasts: Modify key assumptions such as revenue growth, EBITDA margin, and WACC.
- Real-Time Calculations: Instantly observe how your inputs influence the valuation of Centuri Holdings, Inc. (CTRI).
- Professional-Grade Tool: Designed for investors, CFOs, consultants, and financial analysts.
- Intuitive Interface: Organized for clarity and simplicity, complete with step-by-step guidance.
Key Features
- 🔍 Real-Life CTRI Financials: Pre-filled historical and projected data for Centuri Holdings, Inc. (CTRI).
- ✏️ Fully Customizable Inputs: Modify all essential parameters (yellow cells) such as WACC, growth %, and tax rates.
- 📊 Professional DCF Valuation: Integrated formulas assess Centuri's intrinsic value using the Discounted Cash Flow method.
- ⚡ Instant Results: Immediately visualize Centuri’s valuation following any adjustments.
- Scenario Analysis: Evaluate and compare various financial assumptions side-by-side.
How It Works
- Step 1: Download the Excel file.
- Step 2: Review pre-loaded Centuri Holdings, Inc. (CTRI) data (historical and projected).
- Step 3: Modify key assumptions (yellow cells) according to your analysis.
- Step 4: Observe automatic recalculations for Centuri Holdings, Inc. (CTRI)'s intrinsic value.
- Step 5: Utilize the results for your investment strategies or reporting needs.
Why Choose This Calculator for Centuri Holdings, Inc. (CTRI)?
- Accurate Data: Utilize real Centuri financial figures for dependable valuation outcomes.
- Customizable: Tailor essential parameters like growth rates, WACC, and tax rates to align with your forecasts.
- Time-Saving: Built-in calculations allow you to avoid starting from the ground up.
- Professional-Grade Tool: Crafted for investors, analysts, and consultants working with Centuri Holdings, Inc. (CTRI).
- User-Friendly: An intuitive design and comprehensive instructions make the tool accessible for all users.
Who Can Benefit from This Product?
- Investors: Accurately assess Centuri Holdings, Inc.'s (CTRI) fair value prior to making investment choices.
- CFOs: Utilize a high-quality DCF model for thorough financial reporting and analysis.
- Consultants: Efficiently customize the template for client valuation reports.
- Entrepreneurs: Gain valuable insights into the financial modeling practices of leading Fortune 500 companies.
- Educators: Employ it as an instructional tool to illustrate various valuation methodologies.
Contents of the Template
- Operating and Balance Sheet Data: Pre-filled historical data and forecasts for Centuri Holdings, Inc. (CTRI), including revenue, EBITDA, EBIT, and capital expenditures.
- WACC Calculation: A dedicated sheet for Weighted Average Cost of Capital (WACC), featuring key parameters such as Beta, risk-free rate, and share price.
- DCF Valuation (Unlevered and Levered): Editable Discounted Cash Flow models that present intrinsic value with comprehensive calculations.
- Financial Statements: Pre-loaded financial statements (annual and quarterly) to facilitate thorough analysis.
- Key Ratios: Includes profitability, leverage, and efficiency ratios specific to Centuri Holdings, Inc. (CTRI).
- Dashboard and Charts: Visual representation of valuation outputs and assumptions for simplified result analysis.
Disclaimer
All information, articles, and product details provided on this website are for general informational and educational purposes only. We do not claim any ownership over, nor do we intend to infringe upon, any trademarks, copyrights, logos, brand names, or other intellectual property mentioned or depicted on this site. Such intellectual property remains the property of its respective owners, and any references here are made solely for identification or informational purposes, without implying any affiliation, endorsement, or partnership.
We make no representations or warranties, express or implied, regarding the accuracy, completeness, or suitability of any content or products presented. Nothing on this website should be construed as legal, tax, investment, financial, medical, or other professional advice. In addition, no part of this site—including articles or product references—constitutes a solicitation, recommendation, endorsement, advertisement, or offer to buy or sell any securities, franchises, or other financial instruments, particularly in jurisdictions where such activity would be unlawful.
All content is of a general nature and may not address the specific circumstances of any individual or entity. It is not a substitute for professional advice or services. Any actions you take based on the information provided here are strictly at your own risk. You accept full responsibility for any decisions or outcomes arising from your use of this website and agree to release us from any liability in connection with your use of, or reliance upon, the content or products found herein.