|
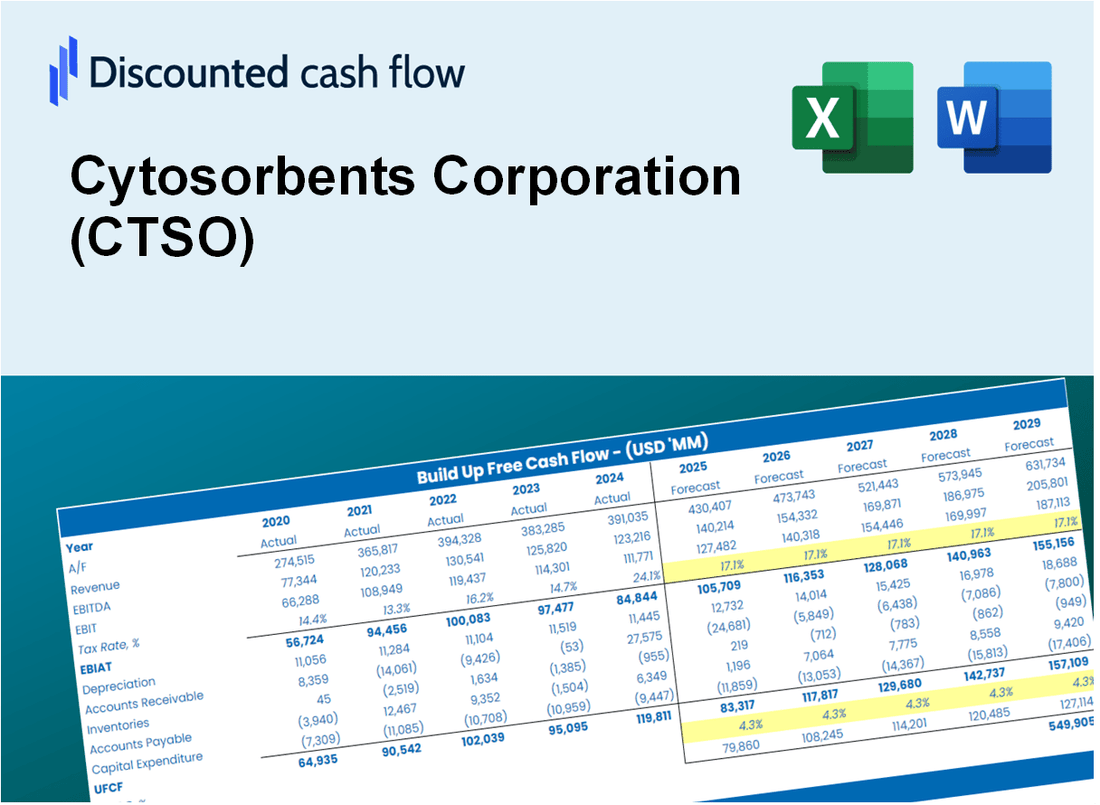
Valoración DCF de Cytosorbents Corporation (CTSO) |
Completamente Editable: Adáptelo A Sus Necesidades En Excel O Sheets
Diseño Profesional: Plantillas Confiables Y Estándares De La Industria
Predeterminadas Para Un Uso Rápido Y Eficiente
Compatible con MAC / PC, completamente desbloqueado
No Se Necesita Experiencia; Fáciles De Seguir
Cytosorbents Corporation (CTSO) Bundle
¡Descubra el verdadero potencial de Cytosorbents Corporation (CTSO) con nuestra calculadora DCF avanzada! Ajuste los supuestos clave, explore varios escenarios y examine cómo los cambios influyen en la valoración de Cytosorbents Corporation (CTSO), todo dentro de una plantilla de Excel conveniente.
What You Will Get
- Real CTSO Financial Data: Pre-filled with Cytosorbents Corporation’s historical and projected data for precise analysis.
- Fully Editable Template: Modify key inputs like revenue growth, WACC, and EBITDA % with ease.
- Automatic Calculations: See Cytosorbents Corporation’s intrinsic value update instantly based on your changes.
- Professional Valuation Tool: Designed for investors, analysts, and consultants seeking accurate DCF results.
- User-Friendly Design: Simple structure and clear instructions for all experience levels.
Key Features
- Comprehensive CTSO Data: Pre-loaded with Cytosorbents Corporation's historical performance metrics and future projections.
- Flexible Input Parameters: Modify revenue growth rates, profit margins, discount rates, tax percentages, and capital investments.
- Adaptive Valuation Framework: Instantaneous recalculations of Net Present Value (NPV) and intrinsic valuation based on user-defined inputs.
- Scenario Analysis: Develop various forecasting scenarios to explore different valuation possibilities.
- Intuitive User Interface: Clear, organized, and tailored for both seasoned professionals and newcomers.
How It Works
- Step 1: Download the Excel file for Cytosorbents Corporation (CTSO).
- Step 2: Review the pre-filled financial data and forecasts for Cytosorbents Corporation (CTSO).
- Step 3: Modify essential inputs such as revenue growth, WACC, and tax rates (highlighted cells).
- Step 4: Observe the DCF model update in real-time as you adjust your assumptions.
- Step 5: Analyze the outputs and leverage the results for your investment decisions regarding Cytosorbents Corporation (CTSO).
Why Choose This Calculator for Cytosorbents Corporation (CTSO)?
- Comprehensive Tool: Integrates DCF, WACC, and financial ratio analyses tailored for Cytosorbents Corporation.
- Customizable Inputs: Modify yellow-highlighted cells to explore different financial scenarios for (CTSO).
- Detailed Insights: Automatically computes the intrinsic value and Net Present Value specific to Cytosorbents Corporation.
- Preloaded Data: Includes historical and projected data to provide reliable starting points for analysis.
- Professional Quality: Designed for financial analysts, investors, and business consultants focusing on (CTSO).
Who Should Use This Product?
- Healthcare Investors: Develop comprehensive valuation models for analyzing Cytosorbents Corporation (CTSO) in their portfolios.
- Medical Finance Teams: Evaluate valuation scenarios to inform strategic decisions within the organization.
- Consultants and Advisors: Deliver precise valuation insights for clients interested in Cytosorbents Corporation (CTSO).
- Students and Educators: Utilize real-time data to enhance learning and practice in financial modeling.
- Biotech Enthusiasts: Gain insights into how biotech firms like Cytosorbents Corporation (CTSO) are assessed in the financial markets.
What the Template Contains
- Comprehensive DCF Model: Editable template featuring detailed valuation calculations tailored for Cytosorbents Corporation (CTSO).
- Real-World Data: Cytosorbents' historical and projected financials preloaded for in-depth analysis.
- Customizable Parameters: Modify WACC, growth rates, and tax assumptions to explore various scenarios.
- Financial Statements: Complete annual and quarterly breakdowns for enhanced insights into the company's performance.
- Key Ratios: Integrated analysis for assessing profitability, efficiency, and leverage metrics.
- Dashboard with Visual Outputs: Visualizations including charts and tables for clear, actionable results.
Disclaimer
All information, articles, and product details provided on this website are for general informational and educational purposes only. We do not claim any ownership over, nor do we intend to infringe upon, any trademarks, copyrights, logos, brand names, or other intellectual property mentioned or depicted on this site. Such intellectual property remains the property of its respective owners, and any references here are made solely for identification or informational purposes, without implying any affiliation, endorsement, or partnership.
We make no representations or warranties, express or implied, regarding the accuracy, completeness, or suitability of any content or products presented. Nothing on this website should be construed as legal, tax, investment, financial, medical, or other professional advice. In addition, no part of this site—including articles or product references—constitutes a solicitation, recommendation, endorsement, advertisement, or offer to buy or sell any securities, franchises, or other financial instruments, particularly in jurisdictions where such activity would be unlawful.
All content is of a general nature and may not address the specific circumstances of any individual or entity. It is not a substitute for professional advice or services. Any actions you take based on the information provided here are strictly at your own risk. You accept full responsibility for any decisions or outcomes arising from your use of this website and agree to release us from any liability in connection with your use of, or reliance upon, the content or products found herein.