
|
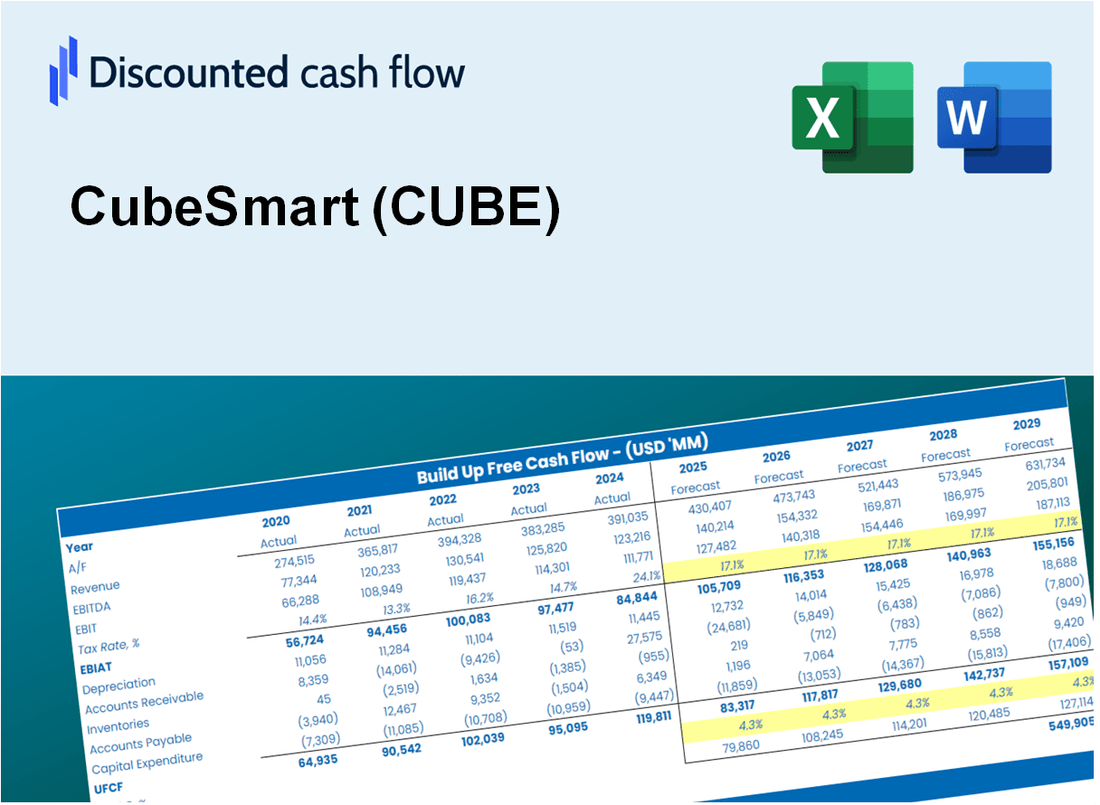
Valoración DCF de CubeSmart (CUBE) |
Completamente Editable: Adáptelo A Sus Necesidades En Excel O Sheets
Diseño Profesional: Plantillas Confiables Y Estándares De La Industria
Predeterminadas Para Un Uso Rápido Y Eficiente
Compatible con MAC / PC, completamente desbloqueado
No Se Necesita Experiencia; Fáciles De Seguir
CubeSmart (CUBE) Bundle
¡Explore el potencial financiero de Cubesmart (Cube) con nuestra calculadora DCF fácil de usar! Ingrese sus proyecciones para el crecimiento, los márgenes de beneficio y los gastos para determinar el valor intrínseco de Cubesmart (Cube) y mejorar su estrategia de inversión.
What You Will Get
- Pre-Filled Financial Model: CubeSmart’s actual data enables precise DCF valuation.
- Full Forecast Control: Adjust revenue growth, margins, WACC, and other key drivers.
- Instant Calculations: Automatic updates ensure you see results as you make changes.
- Investor-Ready Template: A refined Excel file designed for professional-grade valuation.
- Customizable and Reusable: Tailored for flexibility, allowing repeated use for detailed forecasts.
Key Features
- Comprehensive CubeSmart Financials: Gain access to reliable pre-loaded historical data and future forecasts for CubeSmart (CUBE).
- Adjustable Forecast Parameters: Modify highlighted cells for key metrics such as WACC, growth rates, and profit margins.
- Real-Time Calculations: Instant updates to DCF, Net Present Value (NPV), and cash flow assessments.
- User-Friendly Dashboard: Intuitive charts and summaries to help visualize your investment valuation for CubeSmart (CUBE).
- Designed for All Skill Levels: A straightforward, easy-to-navigate structure tailored for investors, CFOs, and consultants alike.
How It Works
- Step 1: Download the Excel file.
- Step 2: Review CubeSmart’s pre-filled financial data and forecasts.
- Step 3: Modify critical inputs like revenue growth, WACC, and tax rates (highlighted cells).
- Step 4: Watch the DCF model update instantly as you tweak assumptions.
- Step 5: Analyze the outputs and use the results for investment decisions.
Why Choose This Calculator for CubeSmart (CUBE)?
- Comprehensive Tool: Integrates DCF, WACC, and financial ratio analyses tailored for CubeSmart (CUBE).
- Customizable Inputs: Modify yellow-highlighted cells to explore different investment scenarios.
- Detailed Insights: Automatically computes CubeSmart’s intrinsic value and Net Present Value.
- Preloaded Data: Historical and projected data provide reliable starting points for analysis.
- Professional Quality: Perfect for financial analysts, investors, and real estate consultants focusing on CubeSmart (CUBE).
Who Should Use This Product?
- Individual Investors: Make informed decisions about buying or selling CubeSmart (CUBE) stock.
- Financial Analysts: Streamline valuation processes with ready-to-use financial models for CubeSmart (CUBE).
- Consultants: Deliver professional valuation insights on CubeSmart (CUBE) to clients quickly and accurately.
- Business Owners: Understand how real estate investment trusts like CubeSmart (CUBE) are valued to guide your own strategy.
- Finance Students: Learn valuation techniques using real-world data and scenarios related to CubeSmart (CUBE).
What the Template Contains
- Comprehensive DCF Model: Editable template featuring detailed valuation calculations for CubeSmart (CUBE).
- Real-World Data: CubeSmart’s historical and projected financials preloaded for in-depth analysis.
- Customizable Parameters: Modify WACC, growth rates, and tax assumptions to explore various scenarios.
- Financial Statements: Complete annual and quarterly breakdowns for enhanced insights.
- Key Ratios: Integrated analysis for profitability, efficiency, and leverage metrics.
- Dashboard with Visual Outputs: Charts and tables designed for clear, actionable results.
Disclaimer
All information, articles, and product details provided on this website are for general informational and educational purposes only. We do not claim any ownership over, nor do we intend to infringe upon, any trademarks, copyrights, logos, brand names, or other intellectual property mentioned or depicted on this site. Such intellectual property remains the property of its respective owners, and any references here are made solely for identification or informational purposes, without implying any affiliation, endorsement, or partnership.
We make no representations or warranties, express or implied, regarding the accuracy, completeness, or suitability of any content or products presented. Nothing on this website should be construed as legal, tax, investment, financial, medical, or other professional advice. In addition, no part of this site—including articles or product references—constitutes a solicitation, recommendation, endorsement, advertisement, or offer to buy or sell any securities, franchises, or other financial instruments, particularly in jurisdictions where such activity would be unlawful.
All content is of a general nature and may not address the specific circumstances of any individual or entity. It is not a substitute for professional advice or services. Any actions you take based on the information provided here are strictly at your own risk. You accept full responsibility for any decisions or outcomes arising from your use of this website and agree to release us from any liability in connection with your use of, or reliance upon, the content or products found herein.