
|
Análisis de 5 Fuerzas de CVB Financial Corp. (CVBF) [Actualizado en enero de 2025] |
Completamente Editable: Adáptelo A Sus Necesidades En Excel O Sheets
Diseño Profesional: Plantillas Confiables Y Estándares De La Industria
Predeterminadas Para Un Uso Rápido Y Eficiente
Compatible con MAC / PC, completamente desbloqueado
No Se Necesita Experiencia; Fáciles De Seguir
CVB Financial Corp. (CVBF) Bundle
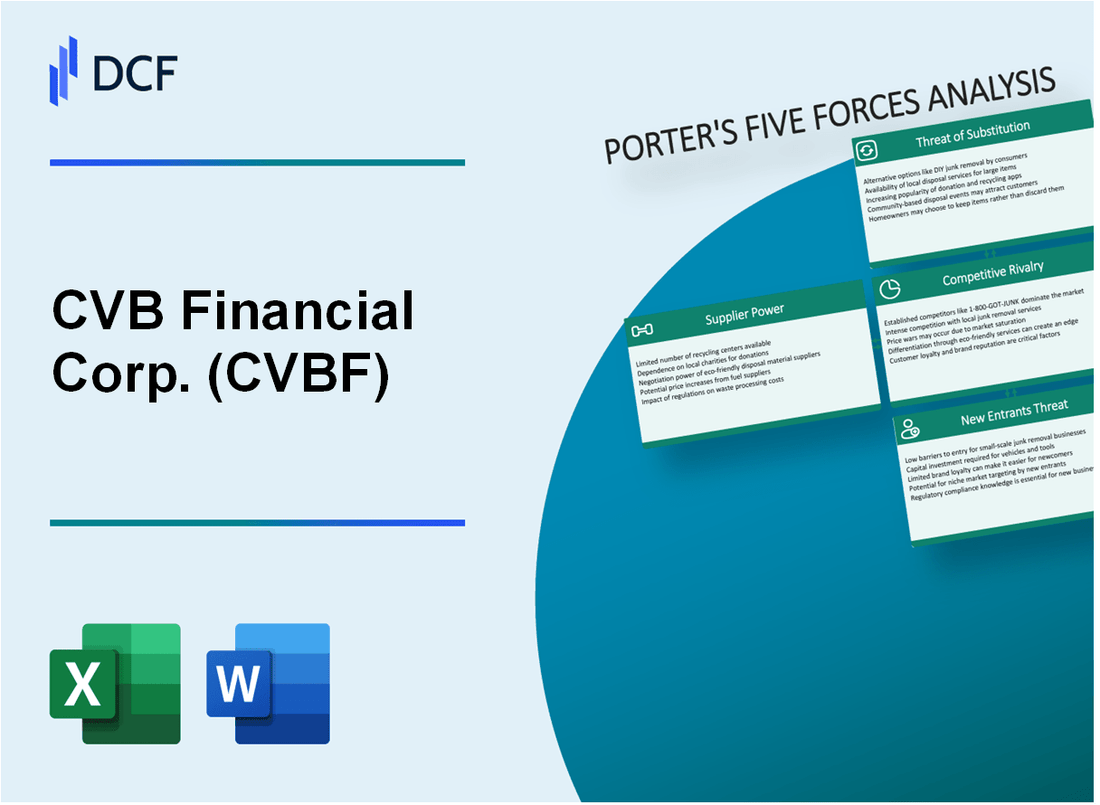
En el panorama dinámico del sector bancario de California, CVB Financial Corp. (CVBF) navega por una compleja red de fuerzas competitivas que dan forma a su posicionamiento estratégico y potencial de crecimiento. Al diseccionar el marco de las cinco fuerzas de Michael Porter, revelamos la intrincada dinámica del poder de los proveedores, las relaciones con los clientes, la rivalidad del mercado, la interrupción tecnológica y las barreras de entrada que definen el ecosistema competitivo de CVBF. Únase a nosotros mientras exploramos los desafíos estratégicos y las oportunidades que determinarán la resistencia y el éxito del banco en un mercado financiero cada vez más digital y competitivo.
CVB Financial Corp. (CVBF) - Las cinco fuerzas de Porter: poder de negociación de los proveedores
Número limitado de tecnología bancaria central y proveedores de software
A partir de 2024, CVB Financial Corp. se basa en un mercado concentrado de proveedores de tecnología bancaria central. Los mejores proveedores incluyen:
| Proveedor | Cuota de mercado | Valor anual del contrato |
|---|---|---|
| Jack Henry & Asociado | 34.5% | $ 1.2 millones |
| Fiserv | 28.3% | $ 1.5 millones |
| FIS Global | 22.7% | $ 1.3 millones |
Altos costos de cambio para la infraestructura bancaria central
Los costos de conmutación para los sistemas bancarios centrales son sustanciales:
- Costos de implementación: $ 3.5 millones a $ 5.2 millones
- Tiempo de transición: 12-18 meses
- Gastos de migración de datos: $ 750,000 a $ 1.1 millones
- Capacitación del personal: $ 250,000 a $ 400,000
Dependencia de proveedores de servicios financieros especializados
CVB Financial Corp. depende de proveedores especializados con capacidades específicas:
| Categoría de servicio | Número de proveedores especializados | Gasto anual promedio |
|---|---|---|
| Ciberseguridad | 7 | $ 2.3 millones |
| Software de cumplimiento | 4 | $ 1.7 millones |
| Gestión de riesgos | 5 | $ 1.9 millones |
Requisitos de cumplimiento regulatorio Relaciones de proveedores de impacto
Las restricciones de cumplimiento regulatoria afectan las negociaciones de los proveedores:
- Requisitos de cumplimiento de la FDIC: 100% de adherencia obligatoria
- Costos de auditoría de cumplimiento anual: $ 450,000
- Gastos de gestión de riesgos de proveedores: $ 325,000
- Sistemas de informes regulatorios: 3 proveedores especializados
CVB Financial Corp. (CVBF) - Cinco fuerzas de Porter: poder de negociación de los clientes
Poder de negociación de clientes corporativos y comerciales
CVB Financial Corp. reportó $ 14.8 mil millones en activos totales al cuarto trimestre de 2023, con clientes comerciales que representan el 62% de su base de clientes. El tamaño promedio del préstamo comercial fue de $ 3.2 millones.
| Segmento de clientes | Total de clientes | Valor de transacción promedio |
|---|---|---|
| Clientes corporativos | 1,247 | $ 4.5 millones |
| Clientes comerciales | 3,589 | $ 3.2 millones |
| Pequeñas empresas | 6,732 | $782,000 |
Diversidad de la base de clientes
CVB Financial opera exclusivamente en California, atendiendo a 12 condados con 108 centros bancarios.
- Concentración geográfica: 100% de mercado de California
- Condados servidos: 12
- Centros bancarios: 108
- Total de clientes: 11,568
Análisis de sensibilidad de precios
El margen de interés neto para CVBF fue del 2.98% en el cuarto trimestre de 2023, lo que indica estrategias de precios competitivas.
Demanda bancaria digital
Las transacciones bancarias en línea aumentaron en un 37% en 2023, y los usuarios de banca móvil alcanzan el 68% de la base total de clientes.
| Métrica de banca digital | 2023 datos |
|---|---|
| Usuarios de banca móvil | 7.866 clientes |
| Volumen de transacciones en línea | 3.2 millones mensuales |
| Crecimiento bancario digital | 37% año tras año |
CVB Financial Corp. (CVBF) - Cinco fuerzas de Porter: rivalidad competitiva
Competencia intensa en el mercado bancario de California
A partir de 2024, CVB Financial Corp. enfrenta una presión competitiva significativa en el mercado bancario de California. El banco compite con 215 bancos comerciales que operan en California, con activos totales de $ 2.3 billones en el sector bancario del estado.
| Categoría de competidor | Número de instituciones | Cuota de mercado |
|---|---|---|
| Grandes bancos nacionales | 12 | 58% |
| Bancos regionales | 37 | 25% |
| Bancos comunitarios | 166 | 17% |
Presencia de bancos regionales y nacionales más grandes
CVB Financial Corp. compite directamente con los principales bancos como:
- Wells Fargo (activos totales: $ 1.9 billones)
- Bank of America (activos totales: $ 3.1 billones)
- JPMorgan Chase (activos totales: $ 3.7 billones)
Fuerte enfoque en el modelo de banca comunitaria
CVB Financial Corp. mantiene un $ 22.4 mil millones de base de activos con una estrategia concentrada en California. El banco atiende a 43 sucursales principalmente en el sur de California, apuntando a pequeñas y medianas empresas.
| Métrico | Rendimiento de CVB Financial Corp. |
|---|---|
| Total de ramas | 43 |
| Enfoque geográfico | Sur de California |
| Cartera de préstamos comerciales | $ 16.7 mil millones |
Diferenciación competitiva a través de servicios personalizados
CVB Financial Corp. se diferencia a través de servicios bancarios especializados:
- Tiempo de respuesta promedio: 2.3 horas para consultas de clientes
- Gestión de relaciones para el 87% de los clientes comerciales
- Tasa de adopción de banca digital: 65% de la base de clientes
CVB Financial Corp. (CVBF) - Cinco fuerzas de Porter: amenaza de sustitutos
Plataformas de banca digital Riesgo de sustitución aumentando
A partir del cuarto trimestre de 2023, las plataformas bancarias digitales han capturado el 65.3% de las interacciones bancarias. El uso de la banca móvil aumentó en un 28,7% en comparación con el año anterior. JPMorgan Chase reportó 54.8 millones de usuarios activos de banca digital en 2023.
| Plataforma de banca digital | Usuarios activos (2023) | Cuota de mercado |
|---|---|---|
| Chase Mobile | 54.8 millones | 22.3% |
| Bank of America Mobile | 42.3 millones | 17.2% |
| Wells Fargo Mobile | 33.6 millones | 13.7% |
Compañías fintech que ofrecen servicios financieros alternativos
Las empresas Fintech recaudaron $ 43.2 mil millones en fondos de capital de riesgo en 2023. PayPal procesó $ 1.36 billones en volumen de pago total en 2023.
- Cuadrado (bloque) procesado $ 197.6 mil millones en volumen de pago bruto
- Stripe procesó $ 817 mil millones en volumen de pago anual
- Robinhood tenía 23,4 millones de usuarios activos en 2023
Tecnologías emergentes de pago móvil e inversión
Apple Pay procesó $ 1.9 billones en pagos móviles durante 2023. Google Pay registró $ 1.4 billones en volumen de transacciones.
| Plataforma de pago móvil | Volumen de transacción 2023 | Base de usuarios |
|---|---|---|
| Apple Pay | $ 1.9 billones | 48.2 millones de usuarios |
| Pago de Google | $ 1.4 billones | 39.6 millones de usuarios |
| Venmo | $ 244 mil millones | 83 millones de usuarios |
Plataformas de criptomonedas y activos digitales
Coinbase reportó $ 90.1 mil millones en volumen de negociación durante 2023. La capitalización de mercado de Bitcoin alcanzó los $ 855.4 mil millones en diciembre de 2023.
- Coinbase: 108 millones de usuarios verificados
- Binance: $ 7.6 billones en volumen de negociación
- Kraken: $ 347 mil millones en volumen de negociación anual
CVB Financial Corp. (CVBF) - Cinco fuerzas de Porter: amenaza de nuevos participantes
Altas barreras reguladoras para la entrada del sector bancario
A partir de 2024, el sector bancario enfrenta requisitos reglamentarios estrictos:
| Aspecto regulatorio | Requisito específico | Costo de cumplimiento |
|---|---|---|
| Requisitos de capital de Basilea III | Relación mínima de nivel de equidad común 1 | 7% de los activos ponderados por el riesgo |
| Seguro FDIC | Seguro de depósito obligatorio | $ 250,000 por depositante |
Requisitos de capital significativos para nuevos bancos
Barreras de capital para la nueva entrada bancaria:
- Requisito mínimo de capital inicial: $ 10-20 millones
- Capital de inicio recomendado: $ 50-100 millones
- Mínimo regulatorio típico: $ 5 millones en capital de nivel 1
Relaciones establecidas de redes y clientes
| Métricas de red CVBF | 2024 datos |
|---|---|
| Red de sucursales totales | 73 ramas |
| Activos totales | $ 18.1 mil millones |
| Cuentas de clientes | Más de 350,000 |
Procesos de cumplimiento y licencia complejos
La complejidad de la licencia implica múltiples aprobaciones regulatorias:
- Aprobación del departamento de banca estatal
- Evaluación de la Reserva Federal
- Verificación de antecedentes de la FDIC
- Certificación contra el lavado de dinero (AML)
La inversión tecnológica necesaria para competir
| Área tecnológica | Inversión estimada |
|---|---|
| Sistema bancario central | $ 2-5 millones |
| Infraestructura de ciberseguridad | $ 1-3 millones anualmente |
| Plataforma de banca digital | $ 500,000- $ 1.5 millones |
CVB Financial Corp. (CVBF) - Porter's Five Forces: Competitive rivalry
You're looking at the competitive rivalry for CVB Financial Corp., and honestly, it's intense. The banking sector in California is packed, meaning the fight for every new deposit and loan is a real grind.
Competitive rivalry here is characterized by high intensity. This is driven by the sheer number of large national and regional banks operating across the state. To put this into perspective, as of the second quarter of 2025, there were 127 banks operating in California. Furthermore, looking just at Southern California, the top 50 banks headquartered there controlled $412 billion in assets as of the end of 2024.
CVB Financial Corp. is definitely in the major leagues, which puts it right in the thick of this competition. CVB Financial Corp. is one of the 10 largest bank holding companies headquartered in California. As of September 30, 2025, the bank reported total assets of $15.7 billion. This size means it is competing directly with much larger entities for market share, especially in the key Southern California markets where it recently expanded its presence into the Temecula-Murrieta region.
Still, CVB Financial Corp. has carved out a strong position through differentiation. The bank has been recognized on Forbes' list of America's Best Banks for nine times in the past decade, including in 2025. They have achieved 194 consecutive quarters of profitability as of the third quarter of 2025. This consistent performance is a key differentiator, as evidenced by S&P Global Market Intelligence ranking CVB Financial Corp. as the second best-performing large U.S. bank by deposit franchise out of 149 banks analyzed as of June 30, 2025.
However, a significant structural factor raises the stakes in rivalry, especially when economic conditions shift: loan concentration. The bank's loan portfolio shows a heavy reliance on one asset class. For the quarter ended June 30, 2025, Commercial Real Estate (CRE) loans made up 78% of the total loan portfolio. By the third quarter of 2025, this concentration remained high, with CRE loans comprising 77% of the loan portfolio. This high concentration means that competitive pressures from other banks-especially those with more diversified loan books-become much more acute during market downturns affecting real estate values.
Here is a quick look at CVB Financial Corp.'s standing and key competitive metrics as of late 2025:
| Metric | Value/Rank | Date/Period |
| Total Assets | $15.7 billion | September 30, 2025 |
| Ranking Among CA Bank Holding Companies | Top 10 Largest | As of early 2025 |
| Consecutive Profitable Quarters | 194 | Q3 2025 |
| CRE Loans as % of Total Loans | 77% | Q3 2025 |
| S&P Deposit Franchise Rank (Assets > $10B) | Second Overall | As of June 30, 2025 |
| Allowance for Credit Losses (ACL) to Gross Loans | 0.94% | September 30, 2025 |
The bank's ability to maintain its low cost of funds, which stood at 1.05% in Q3 2025, is a critical defense against rivals who might try to win deposits by offering higher rates. This low cost of funding is supported by a high percentage of noninterest-bearing deposits, which accounted for approximately 58% of total deposits in Q3 2025.
The competitive environment also involves talent and expansion, which CVB Financial Corp. is actively managing:
- Hired a new Director, Tim Stephens, on November 1, 2025.
- Opened a new Loan Production Office in Temecula, California, on November 5, 2025.
- Maintained 62 business financial centers across California.
- CitizensTrust had $5.2 billion in assets under management and administration at the end of Q3 2025.
Finance: draft a competitive pricing analysis for CRE loans versus the top 5 regional banks by Q4 2025 end.
CVB Financial Corp. (CVBF) - Porter's Five Forces: Threat of substitutes
You're looking at how external players can steal business from CVB Financial Corp.'s core offerings. The threat of substitutes is real, especially as technology makes alternatives more accessible and sometimes cheaper. Honestly, for a bank like CVB Financial Corp., which focuses on small to medium-sized businesses in Southern California, these substitutes chip away at fee income and loan volume.
Fintech payment platforms substitute for traditional cash management and payment services. The pressure here is intense; Accenture estimates that traditional banks could forfeit up to $280 billion in payments revenue to fintech companies by 2025. While CVB Financial Corp. is a regional player, the broader US payments market is projected to be worth USD 13.24 billion in 2025, with online digital wallets and account-to-account transfers growing at an 18.1% CAGR through 2030. Fintechs, like Stripe which processed $1.4 trillion in payment volume in 2024, offer seamless integration that customers now expect.
Direct lending platforms and non-bank lenders bypass commercial loan products. This is a major headwind for Citizens Business Bank's bread and butter. The private credit market, which encompasses direct lending, was valued at $3 trillion at the start of 2025 and is estimated to grow to approximately $5 trillion by 2029. This growth is fueled by borrowers seeking speed and price certainty outside the traditional banking system. For instance, direct lending spreads were recently around SOFR+ 525 basis points, competing with the $400 billion forecasted for commercial and industrial (C&I) lending in the US in 2025.
Wealth management services are substituted by independent brokerages and robo-advisors. CVB Financial Corp.'s CitizensTrust division reported approximately $5.2 billion in assets under management and administration at the end of Q3 2025. This is a small fraction compared to the scale of digital alternatives. The US robo-advisory segment alone is projected to manage $520 billion in assets by 2025. You can see the difference in scale here:
| Entity Type | Name/Segment | Assets Under Management (AUM) |
|---|---|---|
| CVB Financial Corp. Division | CitizensTrust (AUM) | $3.7 billion |
| Top Robo-Advisor | Vanguard Digital Advisor | Over $311 billion |
| Top Robo-Advisor | Empower | $200 billion |
| Top Robo-Advisor | Schwab Intelligent Portfolios | $80.9 billion |
Capital markets provide large businesses with alternatives to bank lending for growth funding. When market conditions allow, larger, more established clients can bypass the bank entirely by issuing debt or equity directly. Investment banking and capital markets are expected to see growth due to lower capital costs, leading to higher equity and debt issuances. While Deloitte forecasts business investment to grow by about 3.6% in 2025, the availability of capital markets financing for larger entities means CVB Financial Corp. is primarily competing for the smaller to mid-sized business segment where direct lending is also a threat.
The competitive forces from these substitutes are shaping client behavior. You see this in the shift:
- Fintechs capturing payments revenue, estimated at up to $280 billion lost by banks by 2025.
- Private credit market size projected to hit $5 trillion by 2029.
- Robo-advisor AUM in the US expected to hit $520 billion in 2025.
- CVB Financial Corp.'s wealth management AUM at $3.7 billion as of Q3 2025.
CVB Financial Corp. (CVBF) - Porter's Five Forces: Threat of new entrants
You're looking at the barriers for a new bank trying to set up shop and compete directly with CVB Financial Corp. today. Honestly, the hurdles are substantial, which is why we don't see a flood of new full-service banks popping up every quarter.
- - High regulatory hurdles and significant capital requirements are strong barriers to entry.
Starting a bank requires navigating a complex web of federal and state regulations, which is a massive upfront time and cost sink. While some recent regulatory clarity in late 2025 has eased certain digital asset requirements for existing national banks, securing a new charter itself remains a process demanding significant initial capital investment and adherence to strict safety and soundness standards. For instance, even established players like SoFi had to pause operations to secure their national banking charter, illustrating the weight of the process. CVB Financial Corp. itself maintains a robust capital position, reporting a Common Equity Tier 1 (CET1) ratio of 16.3% as of September 30, 2025, giving it a substantial buffer that a startup simply cannot match on day one.
- - New entrants struggle to match CVB Financial Corp.'s $15+ billion asset scale and economies of scale.
CVB Financial Corp. is one of the 10 largest bank holding companies headquartered in California, reporting total assets of $15.7 billion at the end of the third quarter of 2025. This scale translates directly into operational efficiencies. New entrants face a steep climb to achieve comparable economies of scale in areas like technology infrastructure, compliance staffing, and physical footprint management. The cost of funds for CVB Financial Corp. in Q3 2025 was a very competitive 1.05%, a figure largely supported by its established size and deposit base.
| Metric | CVB Financial Corp. (Q3 2025) | Implication for New Entrants |
| Total Assets | $15.7 billion | Scale advantage in overhead absorption |
| CET1 Capital Ratio | 16.3% | High capital barrier to match regulatory standing |
| Cost of Funds | 1.05% | Difficulty matching low funding costs |
- - The bank's established, low-cost deposit franchise is difficult for any new competitor to replicate quickly.
This is perhaps the most significant moat for CVB Financial Corp. In September 2025, S&P Global Market Intelligence ranked CVB Financial Corp. as one of the top three large U.S. banks by deposit franchise, taking the second position overall. Furthermore, the bank ranked first out of 149 analyzed banks for average noninterest-bearing deposits to total deposits. As of Q3 2025, these low-cost, noninterest-bearing deposits accounted for approximately 58% of total deposits. Replicating this sticky, low-cost funding source requires years of relationship building with commercial clients, which is not something a new digital-only player can buy.
- - Digital-only challenger banks can enter specific product niches with lower operational costs.
While the overall threat of a full-scale competitor is low, digital-only challengers present a targeted threat. The North America Challenger Banks Market is estimated at $10.91 billion in 2025, projected to grow to $16.88 billion by 2030 at a CAGR of 9.12%. These firms, where digital-only models hold 65-70% of the global market share, focus on specific, high-volume, low-complexity services. For example, globally, payments and money transfers hold a 35%-40% revenue share in 2025. In the US, neobank accounts are projected to hit 39.1 million by 2025. They attack niches like simple checking, savings, and payments with superior mobile user experience and lower fees, thanks to their lack of physical branch overhead. This forces CVB Financial Corp. to continually invest in its digital offerings to prevent customer attrition in those specific product lines.
Disclaimer
All information, articles, and product details provided on this website are for general informational and educational purposes only. We do not claim any ownership over, nor do we intend to infringe upon, any trademarks, copyrights, logos, brand names, or other intellectual property mentioned or depicted on this site. Such intellectual property remains the property of its respective owners, and any references here are made solely for identification or informational purposes, without implying any affiliation, endorsement, or partnership.
We make no representations or warranties, express or implied, regarding the accuracy, completeness, or suitability of any content or products presented. Nothing on this website should be construed as legal, tax, investment, financial, medical, or other professional advice. In addition, no part of this site—including articles or product references—constitutes a solicitation, recommendation, endorsement, advertisement, or offer to buy or sell any securities, franchises, or other financial instruments, particularly in jurisdictions where such activity would be unlawful.
All content is of a general nature and may not address the specific circumstances of any individual or entity. It is not a substitute for professional advice or services. Any actions you take based on the information provided here are strictly at your own risk. You accept full responsibility for any decisions or outcomes arising from your use of this website and agree to release us from any liability in connection with your use of, or reliance upon, the content or products found herein.