
|
CVS Group PLC (CVSG.L) Valoración de DCF |
Completamente Editable: Adáptelo A Sus Necesidades En Excel O Sheets
Diseño Profesional: Plantillas Confiables Y Estándares De La Industria
Predeterminadas Para Un Uso Rápido Y Eficiente
Compatible con MAC / PC, completamente desbloqueado
No Se Necesita Experiencia; Fáciles De Seguir
CVS Group plc (CVSG.L) Bundle
¡Optimice su tiempo y mejore la precisión con nuestra calculadora DCF [símbolo]! Utilizando datos reales de PLC del grupo CVS y supuestos personalizables, esta herramienta le permite pronosticar, analizar y valorar CVS Group PLC (CVSGL) como un inversor experimentado.
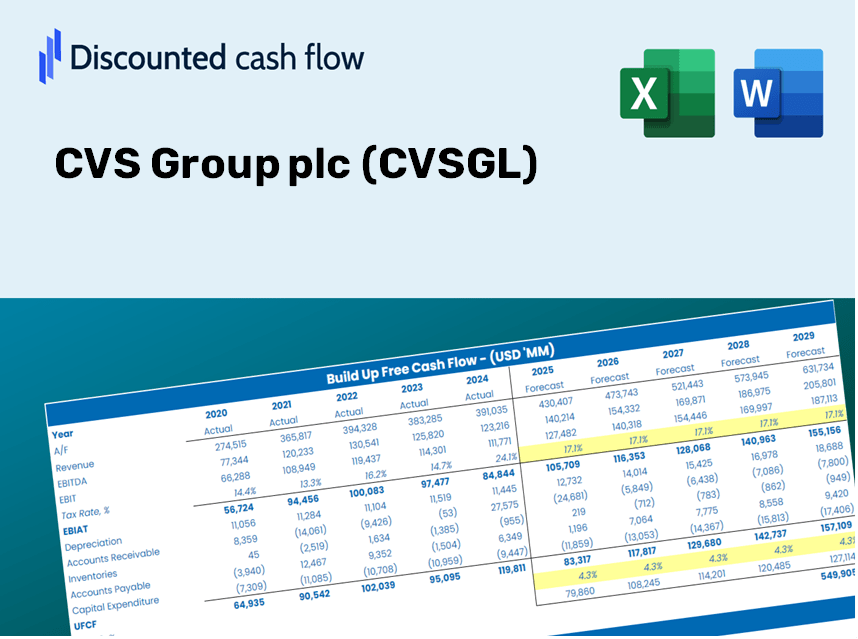
Discounted Cash Flow (DCF) - (USD MM)
| Year | AY1 2020 |
AY2 2021 |
AY3 2022 |
AY4 2023 |
AY5 2024 |
FY1 2025 |
FY2 2026 |
FY3 2027 |
FY4 2028 |
FY5 2029 |
|---|---|---|---|---|---|---|---|---|---|---|
| Revenue | 427.8 | 510.1 | 554.2 | 588.9 | 647.3 | 718.6 | 797.8 | 885.6 | 983.2 | 1,091.5 |
| Revenue Growth, % | 0 | 19.24 | 8.65 | 6.26 | 9.92 | 11.02 | 11.02 | 11.02 | 11.02 | 11.02 |
| EBITDA | 64.9 | 88.2 | 90.4 | 118.8 | 108.4 | 123.2 | 136.7 | 151.8 | 168.5 | 187.1 |
| EBITDA, % | 15.17 | 17.29 | 16.31 | 20.17 | 16.75 | 17.14 | 17.14 | 17.14 | 17.14 | 17.14 |
| Depreciation | 46.4 | 47.7 | 47.6 | 50.4 | 58.5 | 66.7 | 74.0 | 82.2 | 91.2 | 101.3 |
| Depreciation, % | 10.85 | 9.35 | 8.59 | 8.56 | 9.04 | 9.28 | 9.28 | 9.28 | 9.28 | 9.28 |
| EBIT | 18.5 | 40.5 | 42.8 | 68.4 | 49.9 | 56.5 | 62.7 | 69.6 | 77.3 | 85.8 |
| EBIT, % | 4.32 | 7.94 | 7.72 | 11.61 | 7.71 | 7.86 | 7.86 | 7.86 | 7.86 | 7.86 |
| Total Cash | 21.5 | 33.7 | 49.0 | 21.5 | 16.5 | 38.3 | 42.6 | 47.2 | 52.5 | 58.2 |
| Total Cash, percent | .0 | .0 | .0 | .0 | .0 | .0 | .0 | .0 | .0 | .0 |
| Account Receivables | .0 | 39.6 | 42.1 | 48.8 | 55.5 | 46.3 | 51.4 | 57.1 | 63.4 | 70.3 |
| Account Receivables, % | 0 | 7.76 | 7.6 | 8.29 | 8.57 | 6.44 | 6.44 | 6.44 | 6.44 | 6.44 |
| Inventories | 18.7 | 19.5 | 26.2 | 28.4 | 31.8 | 32.6 | 36.1 | 40.1 | 44.6 | 49.5 |
| Inventories, % | 4.37 | 3.82 | 4.73 | 4.82 | 4.91 | 4.53 | 4.53 | 4.53 | 4.53 | 4.53 |
| Accounts Payable | 39.4 | 40.3 | 40.4 | 41.5 | 50.1 | 56.3 | 62.5 | 69.4 | 77.1 | 85.5 |
| Accounts Payable, % | 9.21 | 7.9 | 7.29 | 7.05 | 7.74 | 7.84 | 7.84 | 7.84 | 7.84 | 7.84 |
| Capital Expenditure | -12.4 | -16.6 | -24.5 | -45.7 | -43.1 | -35.9 | -39.9 | -44.3 | -49.1 | -54.6 |
| Capital Expenditure, % | -2.9 | -3.25 | -4.42 | -7.76 | -6.66 | -5 | -5 | -5 | -5 | -5 |
| Tax Rate, % | 83.77 | 83.77 | 83.77 | 83.77 | 83.77 | 83.77 | 83.77 | 83.77 | 83.77 | 83.77 |
| EBITAT | 10.7 | 23.6 | 30.6 | 47.2 | 8.1 | 30.8 | 34.2 | 38.0 | 42.1 | 46.8 |
| Depreciation | ||||||||||
| Changes in Account Receivables | ||||||||||
| Changes in Inventories | ||||||||||
| Changes in Accounts Payable | ||||||||||
| Capital Expenditure | ||||||||||
| UFCF | 65.4 | 15.2 | 44.6 | 44.1 | 22.0 | 76.2 | 65.8 | 73.1 | 81.1 | 90.1 |
| WACC, % | 7.22 | 7.23 | 7.36 | 7.34 | 6.81 | 7.19 | 7.19 | 7.19 | 7.19 | 7.19 |
| PV UFCF | ||||||||||
| SUM PV UFCF | 312.8 | |||||||||
| Long Term Growth Rate, % | 2.00 | |||||||||
| Free cash flow (T + 1) | 92 | |||||||||
| Terminal Value | 1,769 | |||||||||
| Present Terminal Value | 1,250 | |||||||||
| Enterprise Value | 1,563 | |||||||||
| Net Debt | 271 | |||||||||
| Equity Value | 1,292 | |||||||||
| Diluted Shares Outstanding, MM | 72 | |||||||||
| Equity Value Per Share | 1,802.74 |
What You Will Receive
- Customizable Excel Template: A fully adjustable Excel-based DCF Calculator featuring pre-filled CVS Group plc (CVSGL) financial data.
- Up-to-Date Data: Historical figures and forward-looking projections (highlighted in the yellow cells).
- Adjustable Forecasts: Modify key assumptions such as revenue growth, EBITDA %, and WACC.
- Instant Calculations: Quickly observe how your inputs affect the valuation of CVS Group plc (CVSGL).
- Professional Instrument: Designed for investors, CFOs, consultants, and financial analysts.
- Intuitive Layout: Organized for simplicity and ease of navigation, complete with step-by-step guidance.
Key Features
- Pre-Loaded Data: CVS Group plc's historical financial statements and pre-filled forecasts.
- Fully Adjustable Inputs: Customize WACC, tax rates, revenue growth, and EBITDA margins.
- Instant Results: Observe CVS Group plc's intrinsic value recalculating in real time.
- Clear Visual Outputs: Dashboard charts provide insights into valuation results and key metrics.
- Built for Accuracy: A professional tool designed for analysts, investors, and finance professionals.
How It Functions
- Step 1: Download the Excel file for CVS Group plc (CVSGL).
- Step 2: Examine the pre-filled financial data and projections for CVS Group plc (CVSGL).
- Step 3: Adjust key inputs, such as revenue growth, WACC, and tax rates (highlighted cells).
- Step 4: Observe real-time updates to the DCF model as you modify your assumptions.
- Step 5: Review the results and leverage them for informed investment choices regarding CVS Group plc (CVSGL).
Why Opt for This Calculator?
- Time-Efficient: Skip the hassle of building a DCF model from scratch – it’s ready for immediate use.
- Enhanced Accuracy: Dependable financial data and formulas minimize valuation errors.
- Fully Customizable: Adjust the model to align with your specific assumptions and forecasts.
- Simple to Analyze: Intuitive charts and outputs facilitate result interpretation.
- Endorsed by Professionals: Crafted for experts who prioritize precision and user-friendliness.
Who Should Use This Product?
- Investors: Accurately assess CVS Group plc’s fair value before making investment choices.
- CFOs: Utilize a high-quality DCF model for financial reporting and analysis related to CVS Group plc (CVSGL).
- Consultants: Easily customize the template for valuation reports tailored to clients focusing on CVS Group plc (CVSGL).
- Entrepreneurs: Discover insights into the financial modeling practices employed by industry leaders like CVS Group plc (CVSGL).
- Educators: Employ it as a teaching aid to illustrate valuation techniques relevant to CVS Group plc (CVSGL).
Contents of the Template
- Pre-Filled Data: Features CVS Group plc's (CVSGL) historical financial statements and projections.
- Discounted Cash Flow Model: An editable DCF valuation model with automatic computation capabilities.
- Weighted Average Cost of Capital (WACC): A specific sheet for calculating WACC using tailored inputs.
- Key Financial Ratios: Evaluate CVS Group plc's (CVSGL) profitability, efficiency, and financial leverage.
- Customizable Inputs: Easily adjust revenue growth rates, margins, and tax rates.
- Intuitive Dashboard: Visual representations like charts and tables summarizing essential valuation outcomes.
Disclaimer
All information, articles, and product details provided on this website are for general informational and educational purposes only. We do not claim any ownership over, nor do we intend to infringe upon, any trademarks, copyrights, logos, brand names, or other intellectual property mentioned or depicted on this site. Such intellectual property remains the property of its respective owners, and any references here are made solely for identification or informational purposes, without implying any affiliation, endorsement, or partnership.
We make no representations or warranties, express or implied, regarding the accuracy, completeness, or suitability of any content or products presented. Nothing on this website should be construed as legal, tax, investment, financial, medical, or other professional advice. In addition, no part of this site—including articles or product references—constitutes a solicitation, recommendation, endorsement, advertisement, or offer to buy or sell any securities, franchises, or other financial instruments, particularly in jurisdictions where such activity would be unlawful.
All content is of a general nature and may not address the specific circumstances of any individual or entity. It is not a substitute for professional advice or services. Any actions you take based on the information provided here are strictly at your own risk. You accept full responsibility for any decisions or outcomes arising from your use of this website and agree to release us from any liability in connection with your use of, or reliance upon, the content or products found herein.