
|
Valoración DCF de Community West Bancshares (CWBC) |
Completamente Editable: Adáptelo A Sus Necesidades En Excel O Sheets
Diseño Profesional: Plantillas Confiables Y Estándares De La Industria
Predeterminadas Para Un Uso Rápido Y Eficiente
Compatible con MAC / PC, completamente desbloqueado
No Se Necesita Experiencia; Fáciles De Seguir
Community West Bancshares (CWBC) Bundle
¡Hazte cargo de tu comunidad West Bancshares (CWBC) Análisis de valoración con nuestra calculadora DCF de vanguardia! Antes de datos auténticos (CWBC), esta plantilla de Excel le permite ajustar los pronósticos y supuestos para determinar con precisión el valor intrínseco de la comunidad West Bancshares.
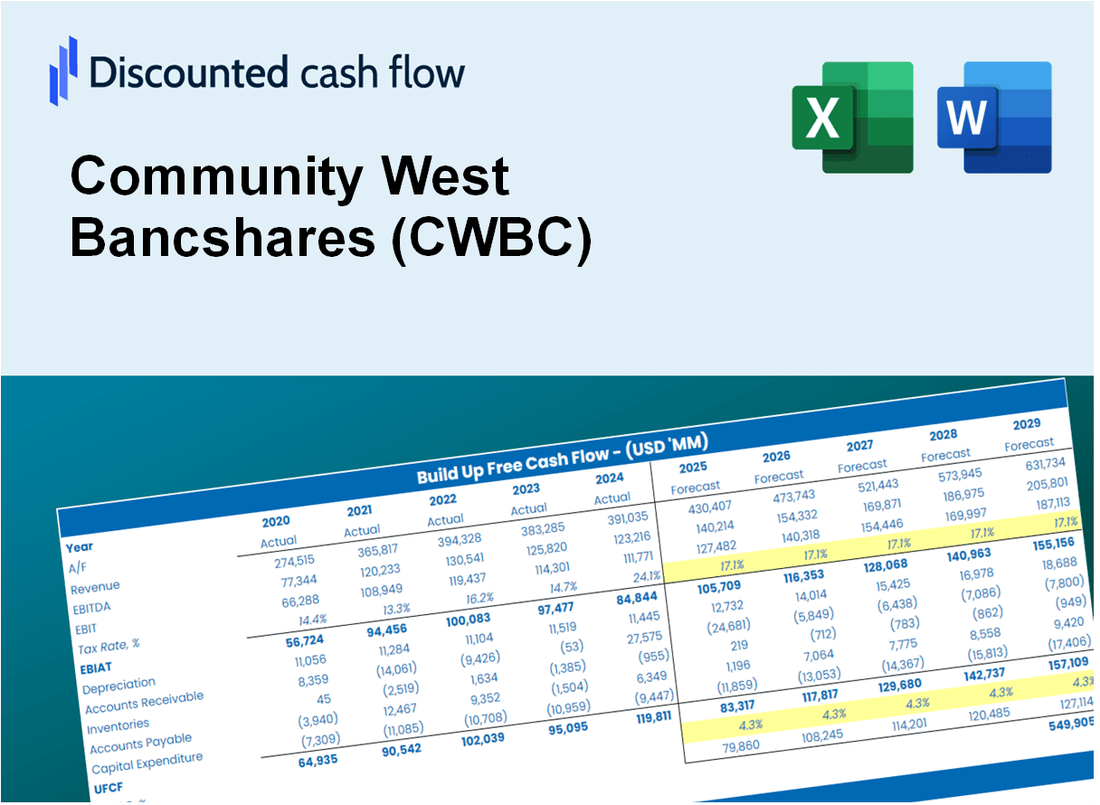
Discounted Cash Flow (DCF) - (USD MM)
| Year | AY1 2020 |
AY2 2021 |
AY3 2022 |
AY4 2023 |
AY5 2024 |
FY1 2025 |
FY2 2026 |
FY3 2027 |
FY4 2028 |
FY5 2029 |
|---|---|---|---|---|---|---|---|---|---|---|
| Revenue | 78.1 | 81.5 | 86.7 | 108.1 | 164.2 | 200.1 | 243.8 | 297.0 | 361.9 | 441.0 |
| Revenue Growth, % | 0 | 4.35 | 6.39 | 24.75 | 51.89 | 21.85 | 21.85 | 21.85 | 21.85 | 21.85 |
| EBITDA | 32.8 | 47.0 | 35.9 | 34.7 | 13.2 | 72.5 | 88.4 | 107.7 | 131.2 | 159.9 |
| EBITDA, % | 41.98 | 57.72 | 41.42 | 32.13 | 8.04 | 36.26 | 36.26 | 36.26 | 36.26 | 36.26 |
| Depreciation | 5.5 | 9.0 | .8 | .9 | 2.2 | 8.5 | 10.3 | 12.6 | 15.3 | 18.6 |
| Depreciation, % | 7.05 | 11.05 | 0.87127 | 0.82422 | 1.34 | 4.23 | 4.23 | 4.23 | 4.23 | 4.23 |
| EBIT | 27.3 | 38.0 | 35.1 | 33.8 | 11.0 | 64.1 | 78.1 | 95.1 | 115.9 | 141.2 |
| EBIT, % | 34.93 | 46.68 | 40.55 | 31.3 | 6.7 | 32.03 | 32.03 | 32.03 | 32.03 | 32.03 |
| Total Cash | 780.4 | 1,272.7 | 680.0 | 461.7 | 423.8 | 200.1 | 243.8 | 297.0 | 361.9 | 441.0 |
| Total Cash, percent | .0 | .0 | .0 | .0 | .0 | .0 | .0 | .0 | .0 | .0 |
| Account Receivables | 29.2 | 32.7 | 76.9 | .0 | .0 | 66.5 | 81.0 | 98.7 | 120.3 | 146.6 |
| Account Receivables, % | 37.36 | 40.16 | 88.7 | 0 | 0 | 33.25 | 33.25 | 33.25 | 33.25 | 33.25 |
| Inventories | .0 | .0 | .0 | .0 | .0 | .0 | .0 | .0 | .0 | .0 |
| Inventories, % | 0 | 0 | 0 | 0 | 0 | 0 | 0 | 0 | 0 | 0 |
| Accounts Payable | 31.2 | 40.0 | 32.6 | .0 | .0 | 50.7 | 61.8 | 75.3 | 91.8 | 111.8 |
| Accounts Payable, % | 39.99 | 49.16 | 37.63 | 0 | 0 | 25.36 | 25.36 | 25.36 | 25.36 | 25.36 |
| Capital Expenditure | -1.5 | -1.0 | -.4 | -9.8 | -5.0 | -6.3 | -7.7 | -9.4 | -11.4 | -13.9 |
| Capital Expenditure, % | -1.91 | -1.29 | -0.41775 | -9.07 | -3.07 | -3.15 | -3.15 | -3.15 | -3.15 | -3.15 |
| Tax Rate, % | 30.3 | 30.3 | 30.3 | 30.3 | 30.3 | 30.3 | 30.3 | 30.3 | 30.3 | 30.3 |
| EBITAT | 20.3 | 28.4 | 26.6 | 25.5 | 7.7 | 47.5 | 57.8 | 70.5 | 85.9 | 104.6 |
| Depreciation | ||||||||||
| Changes in Account Receivables | ||||||||||
| Changes in Inventories | ||||||||||
| Changes in Accounts Payable | ||||||||||
| Capital Expenditure | ||||||||||
| UFCF | 26.4 | 41.6 | -24.5 | 60.9 | 4.8 | 33.8 | 57.0 | 69.5 | 84.6 | 103.1 |
| WACC, % | 11.73 | 11.73 | 11.83 | 11.8 | 11.3 | 11.68 | 11.68 | 11.68 | 11.68 | 11.68 |
| PV UFCF | ||||||||||
| SUM PV UFCF | 239.7 | |||||||||
| Long Term Growth Rate, % | 2.00 | |||||||||
| Free cash flow (T + 1) | 105 | |||||||||
| Terminal Value | 1,087 | |||||||||
| Present Terminal Value | 626 | |||||||||
| Enterprise Value | 865 | |||||||||
| Net Debt | 83 | |||||||||
| Equity Value | 782 | |||||||||
| Diluted Shares Outstanding, MM | 17 | |||||||||
| Equity Value Per Share | 45.54 |
What You Will Get
- Editable Forecast Inputs: Easily modify assumptions (growth %, margins, WACC) to explore various scenarios.
- Real-World Data: Community West Bancshares (CWBC) financial data pre-filled to kickstart your analysis.
- Automatic DCF Outputs: The template computes Net Present Value (NPV) and intrinsic value automatically for you.
- Customizable and Professional: A sleek Excel model designed to meet your valuation requirements.
- Built for Analysts and Investors: Perfect for evaluating projections, confirming strategies, and enhancing efficiency.
Key Features
- Real-Life CWBC Data: Pre-filled with Community West Bancshares’ historical financials and future projections.
- Fully Customizable Inputs: Modify revenue growth, profit margins, WACC, tax rates, and capital expenditures.
- Dynamic Valuation Model: Automatically updates Net Present Value (NPV) and intrinsic value based on your custom inputs.
- Scenario Testing: Generate multiple forecasting scenarios to evaluate different valuation possibilities.
- User-Friendly Design: Intuitive, organized, and crafted for both professionals and novices.
How It Works
- Download the Template: Gain immediate access to the Excel-based CWBC DCF Calculator.
- Input Your Assumptions: Modify the yellow-highlighted cells for growth rates, WACC, margins, and additional parameters.
- Instant Calculations: The model automatically recalculates Community West Bancshares’ intrinsic value.
- Test Scenarios: Experiment with various assumptions to assess potential changes in valuation.
- Analyze and Decide: Utilize the outcomes to inform your investment or financial assessments.
Why Choose This Calculator for Community West Bancshares (CWBC)?
- Designed for Financial Experts: A sophisticated tool tailored for analysts, CFOs, and financial consultants.
- Accurate Financial Data: Community West Bancshares’ historical and projected financials are preloaded for precision.
- Flexible Scenario Analysis: Effortlessly test various forecasts and assumptions.
- Transparent Results: Automatically computes intrinsic value, NPV, and essential financial metrics.
- User-Friendly Interface: Step-by-step guidance ensures a smooth experience throughout the process.
Who Should Use This Product?
- Finance Students: Master financial analysis techniques and apply them to real-world data.
- Academics: Integrate industry-standard models into your teaching or research projects.
- Investors: Evaluate your investment strategies and assess valuation scenarios for Community West Bancshares (CWBC).
- Analysts: Enhance your analysis process with a customizable DCF model tailored for your needs.
- Small Business Owners: Understand the valuation practices used for large public companies like Community West Bancshares (CWBC).
What the Template Contains
- Historical Data: Includes Community West Bancshares’ (CWBC) past financials and baseline forecasts.
- DCF and Levered DCF Models: Detailed templates to calculate Community West Bancshares’ (CWBC) intrinsic value.
- WACC Sheet: Pre-built calculations for Weighted Average Cost of Capital.
- Editable Inputs: Modify key drivers like growth rates, EBITDA %, and CAPEX assumptions.
- Quarterly and Annual Statements: A complete breakdown of Community West Bancshares’ (CWBC) financials.
- Interactive Dashboard: Visualize valuation results and projections dynamically.
Disclaimer
All information, articles, and product details provided on this website are for general informational and educational purposes only. We do not claim any ownership over, nor do we intend to infringe upon, any trademarks, copyrights, logos, brand names, or other intellectual property mentioned or depicted on this site. Such intellectual property remains the property of its respective owners, and any references here are made solely for identification or informational purposes, without implying any affiliation, endorsement, or partnership.
We make no representations or warranties, express or implied, regarding the accuracy, completeness, or suitability of any content or products presented. Nothing on this website should be construed as legal, tax, investment, financial, medical, or other professional advice. In addition, no part of this site—including articles or product references—constitutes a solicitation, recommendation, endorsement, advertisement, or offer to buy or sell any securities, franchises, or other financial instruments, particularly in jurisdictions where such activity would be unlawful.
All content is of a general nature and may not address the specific circumstances of any individual or entity. It is not a substitute for professional advice or services. Any actions you take based on the information provided here are strictly at your own risk. You accept full responsibility for any decisions or outcomes arising from your use of this website and agree to release us from any liability in connection with your use of, or reliance upon, the content or products found herein.