
|
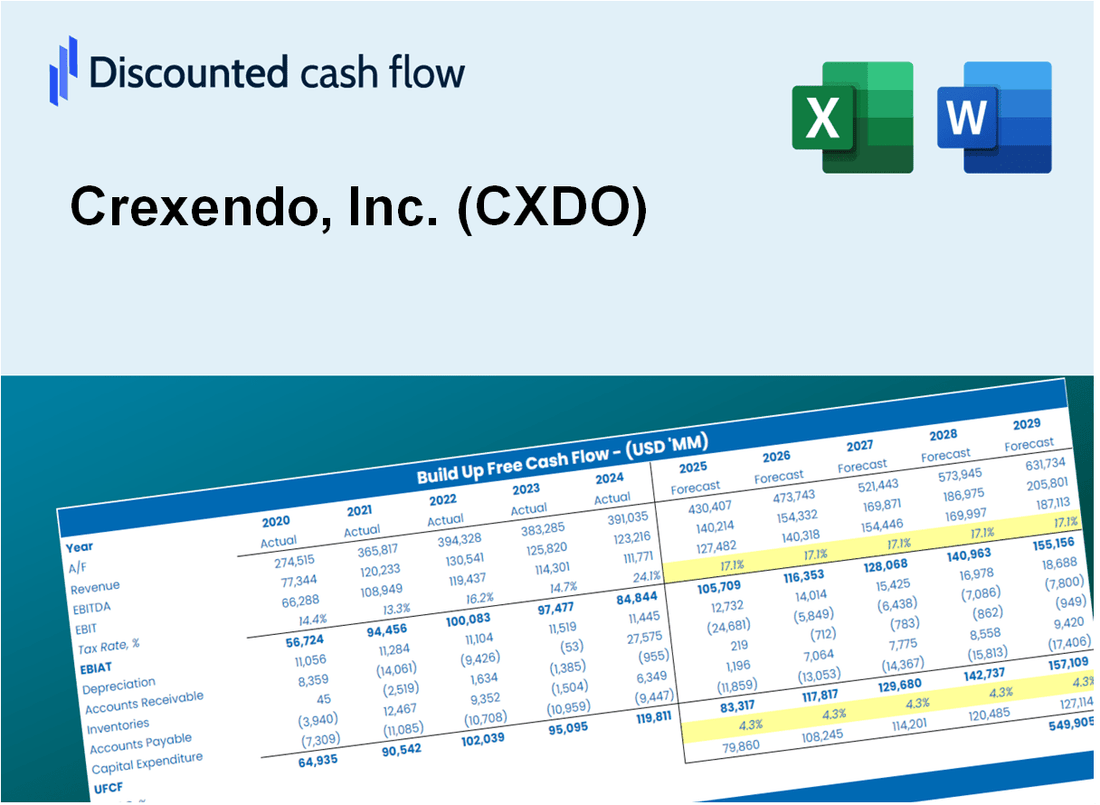
Valoración DCF de Crexendo, Inc. (CXDO) |
Completamente Editable: Adáptelo A Sus Necesidades En Excel O Sheets
Diseño Profesional: Plantillas Confiables Y Estándares De La Industria
Predeterminadas Para Un Uso Rápido Y Eficiente
Compatible con MAC / PC, completamente desbloqueado
No Se Necesita Experiencia; Fáciles De Seguir
Crexendo, Inc. (CXDO) Bundle
¡Simplifique la valoración de Crexendo, Inc. (CXDO) con esta calculadora DCF personalizable! Con el Real Crexendo, Inc. (CXDO) Financials y las entradas de pronóstico ajustable, puede probar escenarios y descubrir el valor razonable de Crexendo, Inc. (CXDO) en minutos.
Discounted Cash Flow (DCF) - (USD MM)
| Year | AY1 2020 |
AY2 2021 |
AY3 2022 |
AY4 2023 |
AY5 2024 |
FY1 2025 |
FY2 2026 |
FY3 2027 |
FY4 2028 |
FY5 2029 |
|---|---|---|---|---|---|---|---|---|---|---|
| Revenue | 16.4 | 28.1 | 37.6 | 53.2 | 60.8 | 85.3 | 119.7 | 168.0 | 235.6 | 330.5 |
| Revenue Growth, % | 0 | 71.43 | 33.68 | 41.66 | 14.36 | 40.28 | 40.28 | 40.28 | 40.28 | 40.28 |
| EBITDA | 2.2 | -1.2 | -33.4 | 3.4 | 5.3 | -11.0 | -15.4 | -21.6 | -30.3 | -42.5 |
| EBITDA, % | 13.63 | -4.27 | -88.81 | 6.44 | 8.65 | -12.87 | -12.87 | -12.87 | -12.87 | -12.87 |
| Depreciation | .3 | 1.6 | 2.7 | 3.6 | 3.3 | 4.6 | 6.4 | 9.0 | 12.7 | 17.8 |
| Depreciation, % | 1.57 | 5.79 | 7.31 | 6.72 | 5.48 | 5.37 | 5.37 | 5.37 | 5.37 | 5.37 |
| EBIT | 2.0 | -2.8 | -36.1 | -.1 | 1.9 | -15.6 | -21.8 | -30.6 | -43.0 | -60.3 |
| EBIT, % | 12.05 | -10.06 | -96.12 | -0.28008 | 3.17 | -18.25 | -18.25 | -18.25 | -18.25 | -18.25 |
| Total Cash | 17.6 | 7.5 | 5.5 | 10.3 | 18.2 | 32.5 | 45.6 | 64.0 | 89.8 | 125.9 |
| Total Cash, percent | .0 | .0 | .0 | .0 | .0 | .0 | .0 | .0 | .0 | .0 |
| Account Receivables | 1.0 | 2.8 | 4.3 | 4.3 | 5.5 | 7.6 | 10.6 | 14.9 | 20.9 | 29.3 |
| Account Receivables, % | 6.02 | 9.9 | 11.32 | 8.14 | 9 | 8.88 | 8.88 | 8.88 | 8.88 | 8.88 |
| Inventories | .5 | .2 | .7 | .4 | .4 | 1.2 | 1.7 | 2.4 | 3.3 | 4.7 |
| Inventories, % | 3.08 | 0.8223 | 1.81 | 0.71806 | 0.64598 | 1.41 | 1.41 | 1.41 | 1.41 | 1.41 |
| Accounts Payable | .6 | 1.1 | 2.2 | 2.1 | 2.6 | 3.6 | 5.1 | 7.1 | 10.0 | 14.0 |
| Accounts Payable, % | 3.42 | 3.86 | 5.84 | 3.88 | 4.24 | 4.25 | 4.25 | 4.25 | 4.25 | 4.25 |
| Capital Expenditure | -.9 | -.1 | -.3 | -.1 | .0 | -1.2 | -1.7 | -2.3 | -3.3 | -4.6 |
| Capital Expenditure, % | -5.62 | -0.35953 | -0.76956 | -0.17294 | -0.04438016 | -1.39 | -1.39 | -1.39 | -1.39 | -1.39 |
| Tax Rate, % | 11.22 | 11.22 | 11.22 | 11.22 | 11.22 | 11.22 | 11.22 | 11.22 | 11.22 | 11.22 |
| EBITAT | 8.3 | -2.4 | -35.3 | -.2 | 1.7 | -14.7 | -20.6 | -28.8 | -40.5 | -56.8 |
| Depreciation | ||||||||||
| Changes in Account Receivables | ||||||||||
| Changes in Inventories | ||||||||||
| Changes in Accounts Payable | ||||||||||
| Capital Expenditure | ||||||||||
| UFCF | 6.7 | -1.8 | -33.7 | 3.4 | 4.4 | -13.1 | -17.9 | -25.1 | -35.2 | -49.4 |
| WACC, % | 8.04 | 8.04 | 8.04 | 8.04 | 8.04 | 8.04 | 8.04 | 8.04 | 8.04 | 8.04 |
| PV UFCF | ||||||||||
| SUM PV UFCF | -106.7 | |||||||||
| Long Term Growth Rate, % | 2.00 | |||||||||
| Free cash flow (T + 1) | -50 | |||||||||
| Terminal Value | -833 | |||||||||
| Present Terminal Value | -566 | |||||||||
| Enterprise Value | -673 | |||||||||
| Net Debt | -16 | |||||||||
| Equity Value | -657 | |||||||||
| Diluted Shares Outstanding, MM | 30 | |||||||||
| Equity Value Per Share | -21.88 |
What You Will Receive
- Comprehensive Financial Model: Crexendo, Inc.’s (CXDO) actual data facilitates accurate DCF valuation.
- Complete Forecast Flexibility: Modify revenue growth, profit margins, WACC, and other essential factors.
- Real-Time Calculations: Automatic updates provide immediate insights as you make adjustments.
- Investor-Ready Format: A polished Excel template crafted for high-quality valuation.
- Adaptable and Reusable: Designed for versatility, allowing repeated application for thorough forecasts.
Key Features
- Customizable Financial Inputs: Adjust essential parameters such as revenue projections, profit margins, and investment costs.
- Instant DCF Valuation: Quickly computes intrinsic value, net present value, and additional financial metrics.
- High-Precision Accuracy: Leverages Crexendo’s (CXDO) actual financial data for dependable valuation results.
- Simplified Scenario Analysis: Effortlessly evaluate various assumptions and assess their impacts.
- Efficiency Booster: Remove the hassle of constructing intricate valuation models from the ground up.
How It Works
- Download the Template: Gain immediate access to the Excel-based CXDO DCF Calculator.
- Input Your Assumptions: Modify the yellow-highlighted cells for growth rates, WACC, margins, and other variables.
- Instant Calculations: The model automatically recalculates Crexendo’s intrinsic value.
- Test Scenarios: Experiment with various assumptions to assess potential valuation shifts.
- Analyze and Decide: Utilize the results to inform your investment or financial analysis.
Why Choose This Calculator for Crexendo, Inc. (CXDO)?
- Accurate Data: Up-to-date Crexendo financials ensure trustworthy valuation outcomes.
- Customizable: Tailor essential parameters like growth rates, WACC, and tax rates to fit your forecasts.
- Time-Saving: Built-in calculations save you from starting from the ground up.
- Professional-Grade Tool: Crafted for investors, analysts, and consultants in the field.
- User-Friendly: Simple design and clear instructions make it accessible for all users.
Who Should Use This Product?
- Investors: Assess Crexendo, Inc.'s (CXDO) valuation prior to making investment decisions.
- CFOs and Financial Analysts: Optimize valuation methodologies and evaluate financial forecasts.
- Startup Founders: Understand the valuation strategies of established companies like Crexendo, Inc.
- Consultants: Provide comprehensive valuation analyses for clients seeking insights on Crexendo, Inc.
- Students and Educators: Utilize real-time data to enhance learning and application of valuation principles.
What the Template Contains
- Pre-Filled Data: Includes Crexendo, Inc.'s (CXDO) historical financials and projections.
- Discounted Cash Flow Model: Editable DCF valuation model with automatic calculations.
- Weighted Average Cost of Capital (WACC): A dedicated sheet for calculating WACC based on custom inputs.
- Key Financial Ratios: Analyze Crexendo, Inc.'s (CXDO) profitability, efficiency, and leverage.
- Customizable Inputs: Edit revenue growth, margins, and tax rates with ease.
- Clear Dashboard: Charts and tables summarizing key valuation results.
Disclaimer
All information, articles, and product details provided on this website are for general informational and educational purposes only. We do not claim any ownership over, nor do we intend to infringe upon, any trademarks, copyrights, logos, brand names, or other intellectual property mentioned or depicted on this site. Such intellectual property remains the property of its respective owners, and any references here are made solely for identification or informational purposes, without implying any affiliation, endorsement, or partnership.
We make no representations or warranties, express or implied, regarding the accuracy, completeness, or suitability of any content or products presented. Nothing on this website should be construed as legal, tax, investment, financial, medical, or other professional advice. In addition, no part of this site—including articles or product references—constitutes a solicitation, recommendation, endorsement, advertisement, or offer to buy or sell any securities, franchises, or other financial instruments, particularly in jurisdictions where such activity would be unlawful.
All content is of a general nature and may not address the specific circumstances of any individual or entity. It is not a substitute for professional advice or services. Any actions you take based on the information provided here are strictly at your own risk. You accept full responsibility for any decisions or outcomes arising from your use of this website and agree to release us from any liability in connection with your use of, or reliance upon, the content or products found herein.