
|
Valoración de DCF Cyient Limited (Cyient.NS) |
Completamente Editable: Adáptelo A Sus Necesidades En Excel O Sheets
Diseño Profesional: Plantillas Confiables Y Estándares De La Industria
Predeterminadas Para Un Uso Rápido Y Eficiente
Compatible con MAC / PC, completamente desbloqueado
No Se Necesita Experiencia; Fáciles De Seguir
Cyient Limited (CYIENT.NS) Bundle
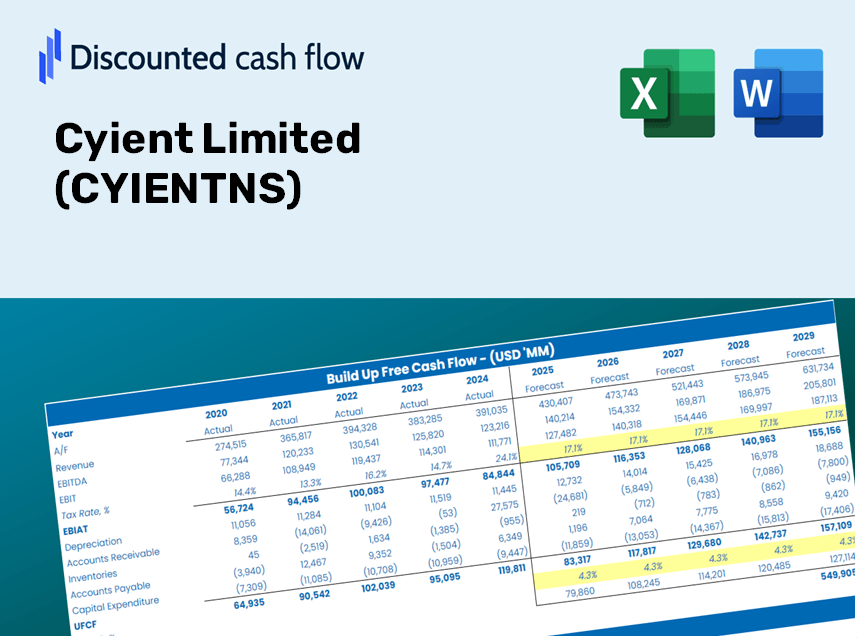
¡Simplifique la valoración de Cyient Limited (Cyientns) con esta calculadora DCF personalizable! Con el Real Cyient Limited (Cyientns) financieros y las entradas de pronóstico ajustables, puede probar escenarios y descubrir el valor razonable de Cyient Limited (Cyientn) en minutos.
Discounted Cash Flow (DCF) - (USD MM)
| Year | AY1 2021 |
AY2 2022 |
AY3 2023 |
AY4 2024 |
AY5 2025 |
FY1 2026 |
FY2 2027 |
FY3 2028 |
FY4 2029 |
FY5 2030 |
|---|---|---|---|---|---|---|---|---|---|---|
| Revenue | 41,324.0 | 45,344.0 | 60,159.0 | 71,472.0 | 73,604.0 | 85,415.3 | 99,122.1 | 115,028.4 | 133,487.1 | 154,908.0 |
| Revenue Growth, % | 0 | 9.73 | 32.67 | 18.81 | 2.98 | 16.05 | 16.05 | 16.05 | 16.05 | 16.05 |
| EBITDA | 7,136.0 | 9,248.0 | 10,227.0 | 13,001.0 | 11,433.0 | 15,099.2 | 17,522.2 | 20,334.0 | 23,597.1 | 27,383.7 |
| EBITDA, % | 17.27 | 20.4 | 17 | 18.19 | 15.53 | 17.68 | 17.68 | 17.68 | 17.68 | 17.68 |
| Depreciation | 1,945.0 | 1,922.0 | 2,566.0 | 2,667.0 | 2,672.0 | 3,514.4 | 4,078.4 | 4,732.9 | 5,492.3 | 6,373.7 |
| Depreciation, % | 4.71 | 4.24 | 4.27 | 3.73 | 3.63 | 4.11 | 4.11 | 4.11 | 4.11 | 4.11 |
| EBIT | 5,191.0 | 7,326.0 | 7,661.0 | 10,334.0 | 8,761.0 | 11,584.8 | 13,443.8 | 15,601.2 | 18,104.7 | 21,010.0 |
| EBIT, % | 12.56 | 16.16 | 12.73 | 14.46 | 11.9 | 13.56 | 13.56 | 13.56 | 13.56 | 13.56 |
| Total Cash | 14,384.0 | 13,004.0 | 7,905.0 | 10,593.0 | 14,677.0 | 19,028.5 | 22,082.1 | 25,625.6 | 29,737.8 | 34,509.9 |
| Total Cash, percent | .0 | .0 | .0 | .0 | .0 | .0 | .0 | .0 | .0 | .0 |
| Account Receivables | 10,285.0 | 10,565.0 | 15,802.0 | 17,352.0 | 17,985.0 | 21,040.9 | 24,417.4 | 28,335.7 | 32,882.8 | 38,159.5 |
| Account Receivables, % | 24.89 | 23.3 | 26.27 | 24.28 | 24.43 | 24.63 | 24.63 | 24.63 | 24.63 | 24.63 |
| Inventories | 1,586.0 | 2,790.0 | 4,358.0 | 4,676.0 | 5,766.0 | 5,400.2 | 6,266.8 | 7,272.4 | 8,439.4 | 9,793.7 |
| Inventories, % | 3.84 | 6.15 | 7.24 | 6.54 | 7.83 | 6.32 | 6.32 | 6.32 | 6.32 | 6.32 |
| Accounts Payable | 4,532.0 | 5,259.0 | 7,142.0 | 5,001.0 | 3,934.0 | 7,991.3 | 9,273.6 | 10,761.8 | 12,488.7 | 14,492.8 |
| Accounts Payable, % | 10.97 | 11.6 | 11.87 | 7 | 5.34 | 9.36 | 9.36 | 9.36 | 9.36 | 9.36 |
| Capital Expenditure | -985.0 | -647.0 | -675.0 | -853.0 | -1,039.0 | -1,287.7 | -1,494.3 | -1,734.1 | -2,012.3 | -2,335.3 |
| Capital Expenditure, % | -2.38 | -1.43 | -1.12 | -1.19 | -1.41 | -1.51 | -1.51 | -1.51 | -1.51 | -1.51 |
| Tax Rate, % | 29.63 | 29.63 | 29.63 | 29.63 | 29.63 | 29.63 | 29.63 | 29.63 | 29.63 | 29.63 |
| EBITAT | 3,958.3 | 5,478.8 | 5,785.1 | 7,683.0 | 6,164.7 | 8,602.0 | 9,982.4 | 11,584.3 | 13,443.3 | 15,600.5 |
| Depreciation | ||||||||||
| Changes in Account Receivables | ||||||||||
| Changes in Inventories | ||||||||||
| Changes in Accounts Payable | ||||||||||
| Capital Expenditure | ||||||||||
| UFCF | -2,420.7 | 5,996.8 | 2,754.1 | 5,488.0 | 5,007.7 | 12,196.0 | 9,605.8 | 11,147.3 | 12,936.1 | 15,012.0 |
| WACC, % | 6.78 | 6.77 | 6.78 | 6.77 | 6.74 | 6.77 | 6.77 | 6.77 | 6.77 | 6.77 |
| PV UFCF | ||||||||||
| SUM PV UFCF | 49,782.0 | |||||||||
| Long Term Growth Rate, % | 4.00 | |||||||||
| Free cash flow (T + 1) | 15,612 | |||||||||
| Terminal Value | 563,806 | |||||||||
| Present Terminal Value | 406,351 | |||||||||
| Enterprise Value | 456,133 | |||||||||
| Net Debt | -7,901 | |||||||||
| Equity Value | 464,034 | |||||||||
| Diluted Shares Outstanding, MM | 111 | |||||||||
| Equity Value Per Share | 4,183.61 |
What You Will Receive
- Adjustable Forecast Inputs: Modify key assumptions (growth %, profit margins, WACC) effortlessly to generate various scenarios.
- Real-Time Data: Cyient Limited's (CYIENTNS) financial information is pre-filled to enhance your analysis.
- Automated DCF Outputs: The template calculates Net Present Value (NPV) and intrinsic value automatically.
- Customizable and Professional Design: A refined Excel model tailored to meet your valuation requirements.
- Tailored for Analysts and Investors: Perfect for evaluating projections, testing strategies, and increasing efficiency.
Key Features
- Customizable Forecast Inputs: Adjust vital parameters such as revenue growth, EBITDA %, and capital expenditures to fit your analysis.
- Instant DCF Valuation: Quickly computes intrinsic value, NPV, and various other financial metrics.
- High Precision Accuracy: Leverages Cyient Limited’s real financial data for dependable valuation results.
- Seamless Scenario Analysis: Effortlessly evaluate different hypotheses and assess the resulting impacts.
- Efficiency Boost: Streamline your workflow by avoiding the hassle of constructing intricate valuation models from the ground up.
How It Works
- Step 1: Download the Excel file for Cyient Limited (CYIENTNS).
- Step 2: Examine the pre-filled financial data and projections for Cyient Limited.
- Step 3: Adjust key inputs such as revenue growth, WACC, and tax rates (highlighted cells).
- Step 4: Observe the DCF model update in real-time as you modify your assumptions.
- Step 5: Evaluate the results and utilize the findings to inform your investment strategies.
Why Choose the Cyient Limited Calculator?
- Time-Saving: Skip the hassle of building a DCF model from the ground up – our tool is ready to go.
- Enhanced Accuracy: Dependable financial data and formulas minimize valuation errors.
- Completely Customizable: Adjust the model to align with your unique assumptions and forecasts.
- User-Friendly: Intuitive charts and outputs simplify result analysis.
- Endorsed by Professionals: Crafted for those who prioritize accuracy and ease of use.
Who Can Benefit from Cyient Limited (CYIENTNS)?
- Investors: Gain confidence in your investment choices with a robust valuation tool tailored for professionals.
- Financial Analysts: Enhance efficiency with a customizable DCF model that is ready to use.
- Consultants: Effortlessly tailor the template for client presentations or reports in no time.
- Finance Enthusiasts: Expand your knowledge of valuation methods through practical, real-world illustrations.
- Educators and Students: Utilize this resource as a hands-on learning tool in finance courses.
What the Template Includes
- Preloaded CYIENTNS Data: Historical and projected financial metrics, encompassing revenue, EBIT, and capital expenditures.
- DCF and WACC Models: Advanced financial sheets for determining intrinsic value and Weighted Average Cost of Capital.
- Editable Inputs: Cells highlighted in yellow for modifying revenue growth, tax rates, and discount rates.
- Financial Statements: Detailed annual and quarterly financial reports for in-depth analysis.
- Key Ratios: Metrics for profitability, leverage, and efficiency to assess performance.
- Dashboard and Charts: Graphical representations of valuation results and underlying assumptions.
Disclaimer
All information, articles, and product details provided on this website are for general informational and educational purposes only. We do not claim any ownership over, nor do we intend to infringe upon, any trademarks, copyrights, logos, brand names, or other intellectual property mentioned or depicted on this site. Such intellectual property remains the property of its respective owners, and any references here are made solely for identification or informational purposes, without implying any affiliation, endorsement, or partnership.
We make no representations or warranties, express or implied, regarding the accuracy, completeness, or suitability of any content or products presented. Nothing on this website should be construed as legal, tax, investment, financial, medical, or other professional advice. In addition, no part of this site—including articles or product references—constitutes a solicitation, recommendation, endorsement, advertisement, or offer to buy or sell any securities, franchises, or other financial instruments, particularly in jurisdictions where such activity would be unlawful.
All content is of a general nature and may not address the specific circumstances of any individual or entity. It is not a substitute for professional advice or services. Any actions you take based on the information provided here are strictly at your own risk. You accept full responsibility for any decisions or outcomes arising from your use of this website and agree to release us from any liability in connection with your use of, or reliance upon, the content or products found herein.