
|
Valoración DCF de Cyngn Inc. (CYN) |
Completamente Editable: Adáptelo A Sus Necesidades En Excel O Sheets
Diseño Profesional: Plantillas Confiables Y Estándares De La Industria
Predeterminadas Para Un Uso Rápido Y Eficiente
Compatible con MAC / PC, completamente desbloqueado
No Se Necesita Experiencia; Fáciles De Seguir
Cyngn Inc. (CYN) Bundle
¡Explore las perspectivas financieras de Cyngn Inc. (CYN) con nuestra calculadora DCF fácil de usar! Simplemente ingrese sus suposiciones para el crecimiento, los márgenes y los gastos para descubrir el valor intrínseco de Cyngn Inc. (CYN) y refinar su enfoque de inversión.
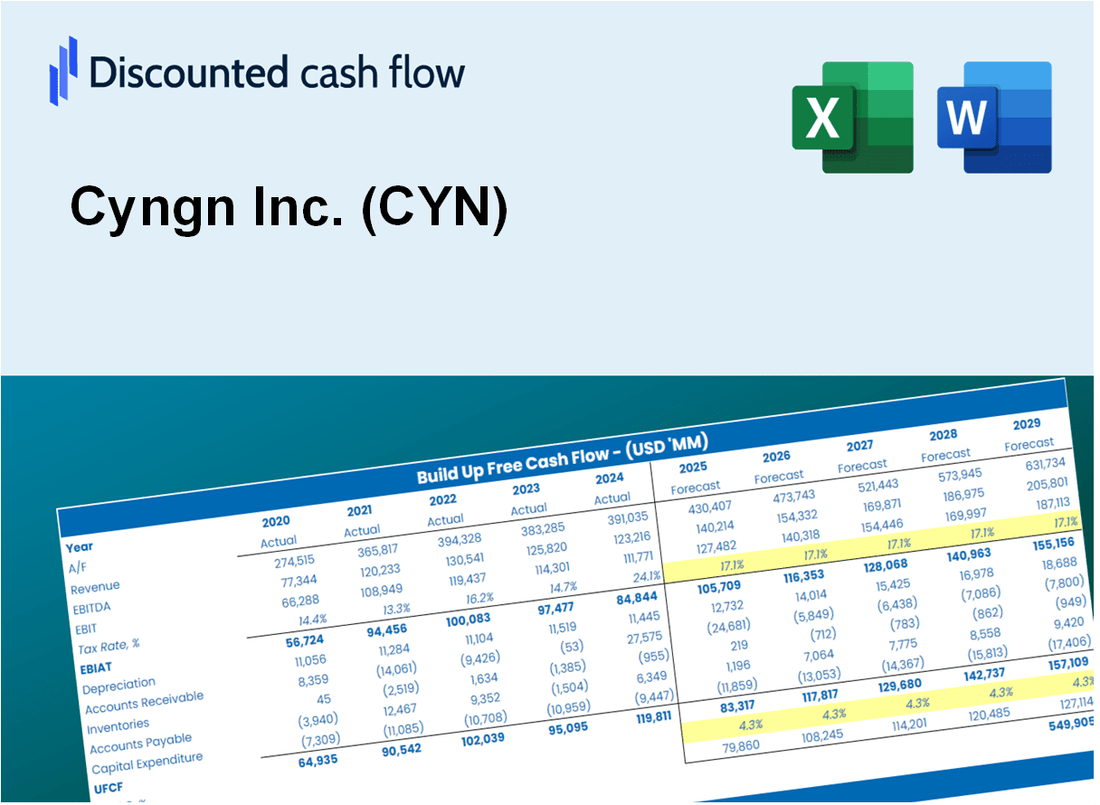
Discounted Cash Flow (DCF) - (USD MM)
| Year | AY1 2020 |
AY2 2021 |
AY3 2022 |
AY4 2023 |
AY5 2024 |
FY1 2025 |
FY2 2026 |
FY3 2027 |
FY4 2028 |
FY5 2029 |
|---|---|---|---|---|---|---|---|---|---|---|
| Revenue | .0 | .0 | .3 | 1.5 | .4 | .4 | .4 | .4 | .5 | .5 |
| Revenue Growth, % | 0 | 0 | 0 | 468.44 | -75.28 | 6.18 | 6.18 | 6.18 | 6.18 | 6.18 |
| EBITDA | -8.2 | -9.3 | -18.8 | -22.4 | -22.2 | -.1 | -.1 | -.1 | -.1 | -.1 |
| EBITDA, % | 100 | 100 | -7173.99 | -1503.02 | -6019.12 | -20 | -20 | -20 | -20 | -20 |
| Depreciation | .2 | .1 | .6 | .9 | .7 | .4 | .4 | .4 | .4 | .5 |
| Depreciation, % | 100 | 100 | 230.87 | 62.53 | 181.84 | 92.51 | 92.51 | 92.51 | 92.51 | 92.51 |
| EBIT | -8.4 | -9.4 | -19.4 | -23.3 | -22.8 | -.1 | -.1 | -.1 | -.1 | -.1 |
| EBIT, % | 100 | 100 | -7404.86 | -1565.55 | -6200.96 | -20 | -20 | -20 | -20 | -20 |
| Total Cash | 6.1 | 21.9 | 22.6 | 8.2 | 23.6 | .4 | .4 | .4 | .5 | .5 |
| Total Cash, percent | .0 | .0 | .0 | .0 | .0 | .0 | .0 | .0 | .0 | .0 |
| Account Receivables | .0 | .0 | .2 | .8 | .8 | .3 | .4 | .4 | .4 | .4 |
| Account Receivables, % | 100 | 100 | 80.51 | 52.05 | 207.96 | 86.51 | 86.51 | 86.51 | 86.51 | 86.51 |
| Inventories | .0 | .0 | .1 | .0 | .2 | .2 | .2 | .2 | .2 | .3 |
| Inventories, % | 100 | 100 | 25.49 | 0 | 40.81 | 53.26 | 53.26 | 53.26 | 53.26 | 53.26 |
| Accounts Payable | .1 | .1 | .2 | .2 | .3 | .3 | .3 | .3 | .3 | .4 |
| Accounts Payable, % | 100 | 100 | 59.52 | 13.23 | 80.89 | 70.73 | 70.73 | 70.73 | 70.73 | 70.73 |
| Capital Expenditure | .0 | -.1 | -1.4 | -1.8 | -1.1 | -.2 | -.2 | -.3 | -.3 | -.3 |
| Capital Expenditure, % | 100 | 100 | -524.86 | -118.48 | -285.62 | -60 | -60 | -60 | -60 | -60 |
| Tax Rate, % | 0 | 0 | 0 | 0 | 0 | 0 | 0 | 0 | 0 | 0 |
| EBITAT | -8.4 | -9.4 | -19.4 | -23.3 | -22.8 | -.1 | -.1 | -.1 | -.1 | -.1 |
| Depreciation | ||||||||||
| Changes in Account Receivables | ||||||||||
| Changes in Inventories | ||||||||||
| Changes in Accounts Payable | ||||||||||
| Capital Expenditure | ||||||||||
| UFCF | -8.1 | -9.3 | -20.4 | -24.6 | -23.2 | .4 | .0 | .0 | .0 | .0 |
| WACC, % | 20.8 | 20.8 | 20.8 | 20.8 | 20.8 | 20.8 | 20.8 | 20.8 | 20.8 | 20.8 |
| PV UFCF | ||||||||||
| SUM PV UFCF | .4 | |||||||||
| Long Term Growth Rate, % | 2.00 | |||||||||
| Free cash flow (T + 1) | 0 | |||||||||
| Terminal Value | 0 | |||||||||
| Present Terminal Value | 0 | |||||||||
| Enterprise Value | 0 | |||||||||
| Net Debt | -23 | |||||||||
| Equity Value | 24 | |||||||||
| Diluted Shares Outstanding, MM | 1 | |||||||||
| Equity Value Per Share | 18.00 |
What You Will Get
- Real CYN Financial Data: Pre-filled with Cyngn Inc.’s historical and projected data for precise analysis.
- Fully Editable Template: Modify key inputs like revenue growth, WACC, and EBITDA % with ease.
- Automatic Calculations: See Cyngn Inc.’s intrinsic value update instantly based on your changes.
- Professional Valuation Tool: Designed for investors, analysts, and consultants seeking accurate DCF results.
- User-Friendly Design: Simple structure and clear instructions for all experience levels.
Key Features
- Comprehensive Data Access: Cyngn Inc.'s historical financial records and pre-filled projections.
- Customizable Inputs: Modify WACC, tax rates, revenue growth, and EBITDA margins as needed.
- Real-Time Results: Observe Cyngn Inc.'s intrinsic value update instantly.
- Intuitive Visual Outputs: Dashboard graphs illustrate valuation outcomes and essential metrics.
- Designed for Precision: A professional-grade tool for analysts, investors, and finance professionals.
How It Works
- Download the Template: Gain immediate access to the Excel-based CYN DCF Calculator.
- Input Your Assumptions: Modify the yellow-highlighted cells for growth rates, WACC, margins, and additional parameters.
- Instant Calculations: The model updates Cyngn Inc.’s intrinsic value automatically.
- Test Scenarios: Experiment with various assumptions to assess potential valuation shifts.
- Analyze and Decide: Utilize the results to inform your investment or financial analysis.
Why Choose Cyngn Inc. (CYN)?
- Innovative Solutions: Leverage cutting-edge technology to drive efficiency and productivity.
- Proven Track Record: A history of delivering reliable and effective software solutions.
- Scalable Options: Flexible services that grow with your business needs and demands.
- User-Friendly Interface: Intuitive design ensures ease of use for all team members.
- Expert Support: Dedicated customer service team ready to assist with any inquiries.
Who Should Use Cyngn Inc. (CYN)?
- Investors: Gain insights into cutting-edge autonomous vehicle technology and make informed investment choices.
- Industry Analysts: Utilize comprehensive data and analytics to evaluate market trends and company performance.
- Consultants: Tailor presentations and reports with up-to-date information on Cyngn's innovations and market position.
- Tech Enthusiasts: Explore the future of mobility and autonomous systems through Cyngn's advancements.
- Educators and Students: Leverage case studies and materials for a deeper understanding of the tech and automotive industries.
What the Template Contains
- Pre-Filled Data: Includes Cyngn Inc.'s historical financials and forecasts.
- Discounted Cash Flow Model: Editable DCF valuation model with automatic calculations.
- Weighted Average Cost of Capital (WACC): A dedicated sheet for calculating WACC based on custom inputs.
- Key Financial Ratios: Analyze Cyngn Inc.'s profitability, efficiency, and leverage.
- Customizable Inputs: Edit revenue growth, margins, and tax rates with ease.
- Clear Dashboard: Charts and tables summarizing key valuation results.
Disclaimer
All information, articles, and product details provided on this website are for general informational and educational purposes only. We do not claim any ownership over, nor do we intend to infringe upon, any trademarks, copyrights, logos, brand names, or other intellectual property mentioned or depicted on this site. Such intellectual property remains the property of its respective owners, and any references here are made solely for identification or informational purposes, without implying any affiliation, endorsement, or partnership.
We make no representations or warranties, express or implied, regarding the accuracy, completeness, or suitability of any content or products presented. Nothing on this website should be construed as legal, tax, investment, financial, medical, or other professional advice. In addition, no part of this site—including articles or product references—constitutes a solicitation, recommendation, endorsement, advertisement, or offer to buy or sell any securities, franchises, or other financial instruments, particularly in jurisdictions where such activity would be unlawful.
All content is of a general nature and may not address the specific circumstances of any individual or entity. It is not a substitute for professional advice or services. Any actions you take based on the information provided here are strictly at your own risk. You accept full responsibility for any decisions or outcomes arising from your use of this website and agree to release us from any liability in connection with your use of, or reliance upon, the content or products found herein.