
|
Valoración DCF de Diebold Nixdorf, Incorporated (DBD) |
Completamente Editable: Adáptelo A Sus Necesidades En Excel O Sheets
Diseño Profesional: Plantillas Confiables Y Estándares De La Industria
Predeterminadas Para Un Uso Rápido Y Eficiente
Compatible con MAC / PC, completamente desbloqueado
No Se Necesita Experiencia; Fáciles De Seguir
Diebold Nixdorf, Incorporated (DBD) Bundle
¡Desbloquee Diebold Nixdorf, el verdadero valor de Incorporated con nuestra calculadora DCF de grado profesional! Modifique los supuestos clave, pruebe múltiples escenarios y analice cómo los cambios afectan a Diebold nixdorf, valoración incorporada (DBD): todo en una sola plantilla de Excel.
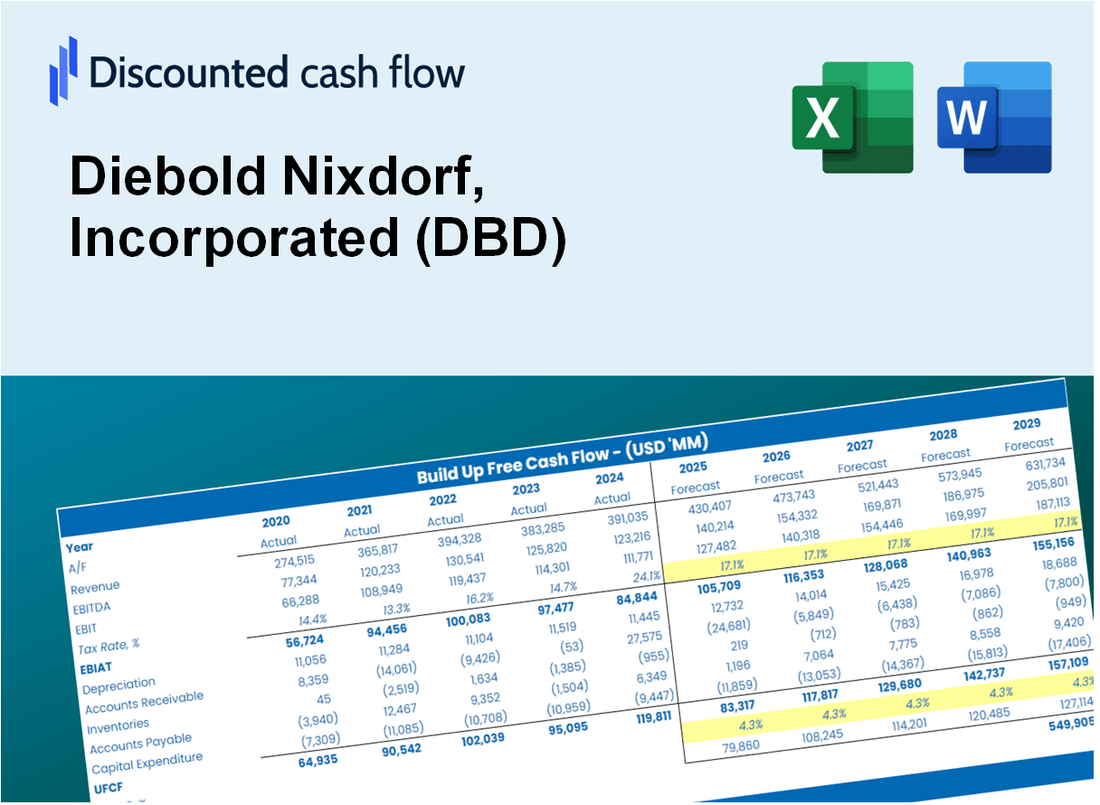
Discounted Cash Flow (DCF) - (USD MM)
| Year | AY1 2020 |
AY2 2021 |
AY3 2022 |
AY4 2023 |
AY5 2024 |
FY1 2025 |
FY2 2026 |
FY3 2027 |
FY4 2028 |
FY5 2029 |
|---|---|---|---|---|---|---|---|---|---|---|
| Revenue | 3,902.3 | 3,905.2 | 3,460.7 | 3,760.5 | 3,751.1 | 3,724.0 | 3,697.0 | 3,670.2 | 3,643.7 | 3,617.3 |
| Revenue Growth, % | 0 | 0.07431515 | -11.38 | 8.66 | -0.24997 | -0.72373 | -0.72373 | -0.72373 | -0.72373 | -0.72373 |
| EBITDA | 177.7 | 293.7 | -113.4 | 275.0 | 334.9 | 186.5 | 185.1 | 183.8 | 182.5 | 181.1 |
| EBITDA, % | 4.55 | 7.52 | -3.28 | 7.31 | 8.93 | 5.01 | 5.01 | 5.01 | 5.01 | 5.01 |
| Depreciation | 180.4 | 149.1 | 126.0 | 126.4 | 132.3 | 141.3 | 140.3 | 139.2 | 138.2 | 137.2 |
| Depreciation, % | 4.62 | 3.82 | 3.64 | 3.36 | 3.53 | 3.79 | 3.79 | 3.79 | 3.79 | 3.79 |
| EBIT | -2.7 | 144.6 | -239.4 | 148.6 | 202.6 | 45.2 | 44.9 | 44.5 | 44.2 | 43.9 |
| EBIT, % | -0.06918996 | 3.7 | -6.92 | 3.95 | 5.4 | 1.21 | 1.21 | 1.21 | 1.21 | 1.21 |
| Total Cash | 361.7 | 423.2 | 332.0 | 563.6 | 313.1 | 395.0 | 392.1 | 389.3 | 386.5 | 383.7 |
| Total Cash, percent | .0 | .0 | .0 | .0 | .0 | .0 | .0 | .0 | .0 | .0 |
| Account Receivables | 646.9 | 595.2 | 612.2 | 721.8 | 588.5 | 628.5 | 624.0 | 619.5 | 615.0 | 610.5 |
| Account Receivables, % | 16.58 | 15.24 | 17.69 | 19.19 | 15.69 | 16.88 | 16.88 | 16.88 | 16.88 | 16.88 |
| Inventories | 498.2 | 544.2 | 588.1 | 589.8 | 528.1 | 547.1 | 543.2 | 539.2 | 535.3 | 531.4 |
| Inventories, % | 12.77 | 13.94 | 16.99 | 15.68 | 14.08 | 14.69 | 14.69 | 14.69 | 14.69 | 14.69 |
| Accounts Payable | 499.9 | 706.3 | 611.6 | 529.0 | 460.2 | 557.9 | 553.8 | 549.8 | 545.9 | 541.9 |
| Accounts Payable, % | 12.81 | 18.09 | 17.67 | 14.07 | 12.27 | 14.98 | 14.98 | 14.98 | 14.98 | 14.98 |
| Capital Expenditure | -44.7 | -51.3 | -53.1 | -24.9 | -17.4 | -38.1 | -37.9 | -37.6 | -37.3 | -37.0 |
| Capital Expenditure, % | -1.15 | -1.31 | -1.53 | -0.66215 | -0.46386 | -1.02 | -1.02 | -1.02 | -1.02 | -1.02 |
| Tax Rate, % | 133.13 | 133.13 | 133.13 | 133.13 | 133.13 | 133.13 | 133.13 | 133.13 | 133.13 | 133.13 |
| EBITAT | -2.7 | 226.1 | -318.9 | 140.8 | -67.1 | 35.7 | 35.4 | 35.2 | 34.9 | 34.7 |
| Depreciation | ||||||||||
| Changes in Account Receivables | ||||||||||
| Changes in Inventories | ||||||||||
| Changes in Accounts Payable | ||||||||||
| Capital Expenditure | ||||||||||
| UFCF | -512.2 | 536.0 | -401.6 | 48.4 | 174.0 | 177.5 | 142.3 | 141.3 | 140.3 | 139.2 |
| WACC, % | 12.32 | 12.32 | 12.32 | 12.08 | 7.87 | 11.38 | 11.38 | 11.38 | 11.38 | 11.38 |
| PV UFCF | ||||||||||
| SUM PV UFCF | 548.7 | |||||||||
| Long Term Growth Rate, % | 2.00 | |||||||||
| Free cash flow (T + 1) | 142 | |||||||||
| Terminal Value | 1,514 | |||||||||
| Present Terminal Value | 883 | |||||||||
| Enterprise Value | 1,432 | |||||||||
| Net Debt | 751 | |||||||||
| Equity Value | 681 | |||||||||
| Diluted Shares Outstanding, MM | 38 | |||||||||
| Equity Value Per Share | 18.11 |
What You Will Get
- Editable Excel Template: A fully customizable Excel-based DCF Calculator featuring pre-filled real DBD financials.
- Real-World Data: Historical data and forward-looking estimates (highlighted in the yellow cells).
- Forecast Flexibility: Adjust forecast assumptions such as revenue growth, EBITDA %, and WACC.
- Automatic Calculations: Instantly observe how your inputs affect Diebold Nixdorf's valuation.
- Professional Tool: Designed for investors, CFOs, consultants, and financial analysts.
- User-Friendly Design: Organized for clarity and ease of use, complete with step-by-step instructions.
Key Features
- Accurate Diebold Nixdorf Financials: Gain access to reliable pre-loaded historical data and future forecasts.
- Adjustable Forecast Parameters: Modify highlighted cells for assumptions like WACC, growth rates, and profit margins.
- Real-Time Calculations: Automatic updates for DCF, Net Present Value (NPV), and cash flow assessments.
- Interactive Dashboard: User-friendly charts and summaries to effectively visualize your valuation outcomes.
- Suitable for All Skill Levels: A straightforward, intuitive layout designed for investors, CFOs, and consultants alike.
How It Works
- Download the Template: Gain immediate access to the Excel-based DBD DCF Calculator.
- Input Your Assumptions: Modify the yellow-highlighted cells for growth rates, WACC, margins, and other parameters.
- Instant Calculations: The model automatically recalculates Diebold Nixdorf’s intrinsic value.
- Test Scenarios: Experiment with different assumptions to assess potential changes in valuation.
- Analyze and Decide: Leverage the results to inform your investment or financial analysis.
Why Choose This Calculator for Diebold Nixdorf, Incorporated (DBD)?
- Accurate Data: Current Diebold Nixdorf financials provide dependable valuation outcomes.
- Customizable: Modify essential parameters such as growth rates, WACC, and tax rates to align with your forecasts.
- Time-Saving: Ready-to-use calculations remove the hassle of starting from the ground up.
- Professional-Grade Tool: Tailored for investors, analysts, and consultants in the field.
- User-Friendly: Clear layout and guided instructions make it accessible for all users.
Who Should Use This Product?
- Investors: Accurately assess Diebold Nixdorf's fair value prior to making investment choices.
- CFOs: Utilize a top-tier DCF model for financial analysis and reporting.
- Consultants: Easily customize the template for client valuation reports.
- Entrepreneurs: Acquire knowledge of financial modeling techniques employed by leading companies.
- Educators: Implement it as a resource for teaching valuation methods.
What the Template Contains
- Operating and Balance Sheet Data: Pre-filled Diebold Nixdorf historical data and forecasts, including revenue, EBITDA, EBIT, and capital expenditures.
- WACC Calculation: A dedicated sheet for Weighted Average Cost of Capital (WACC), featuring parameters like Beta, risk-free rate, and share price.
- DCF Valuation (Unlevered and Levered): Editable Discounted Cash Flow models illustrating intrinsic value with comprehensive calculations.
- Financial Statements: Pre-loaded financial statements (annual and quarterly) to facilitate analysis.
- Key Ratios: Includes profitability, leverage, and efficiency ratios for Diebold Nixdorf (DBD).
- Dashboard and Charts: Visual summary of valuation outputs and assumptions for easy result analysis.
Disclaimer
All information, articles, and product details provided on this website are for general informational and educational purposes only. We do not claim any ownership over, nor do we intend to infringe upon, any trademarks, copyrights, logos, brand names, or other intellectual property mentioned or depicted on this site. Such intellectual property remains the property of its respective owners, and any references here are made solely for identification or informational purposes, without implying any affiliation, endorsement, or partnership.
We make no representations or warranties, express or implied, regarding the accuracy, completeness, or suitability of any content or products presented. Nothing on this website should be construed as legal, tax, investment, financial, medical, or other professional advice. In addition, no part of this site—including articles or product references—constitutes a solicitation, recommendation, endorsement, advertisement, or offer to buy or sell any securities, franchises, or other financial instruments, particularly in jurisdictions where such activity would be unlawful.
All content is of a general nature and may not address the specific circumstances of any individual or entity. It is not a substitute for professional advice or services. Any actions you take based on the information provided here are strictly at your own risk. You accept full responsibility for any decisions or outcomes arising from your use of this website and agree to release us from any liability in connection with your use of, or reliance upon, the content or products found herein.