
|
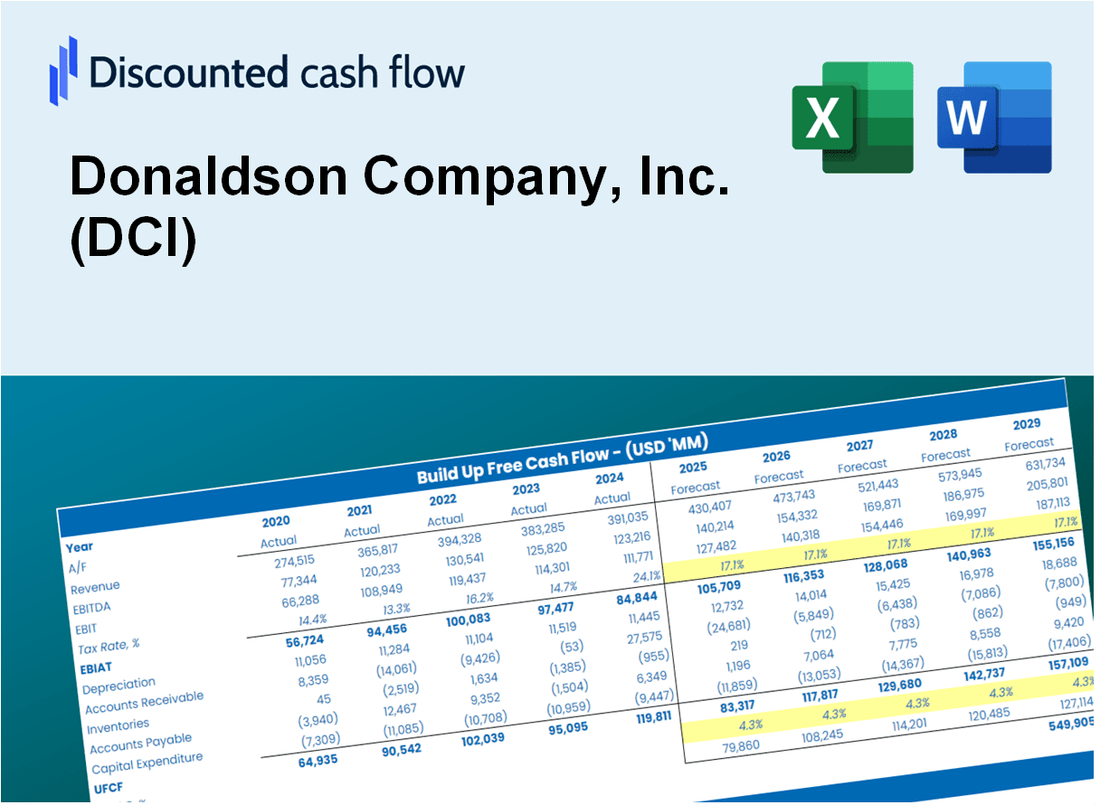
Valoración DCF de Donaldson Company, Inc. (DCI) |
Completamente Editable: Adáptelo A Sus Necesidades En Excel O Sheets
Diseño Profesional: Plantillas Confiables Y Estándares De La Industria
Predeterminadas Para Un Uso Rápido Y Eficiente
Compatible con MAC / PC, completamente desbloqueado
No Se Necesita Experiencia; Fáciles De Seguir
Donaldson Company, Inc. (DCI) Bundle
Ya sea que sea un inversor o un analista, esta calculadora DCF (DCI) es su herramienta de referencia para una valoración precisa. Con datos reales de Donaldson Company, Inc., puede ajustar las previsiones y observar los efectos en tiempo real.
What You Will Get
- Real DCI Financials: Access to historical and projected data for precise valuation.
- Customizable Inputs: Adjust WACC, tax rates, revenue growth, and capital expenditures as needed.
- Dynamic Calculations: Intrinsic value and NPV are computed in real-time.
- Scenario Analysis: Evaluate multiple scenarios to assess Donaldson Company’s future performance.
- User-Friendly Design: Designed for professionals but easy for beginners to navigate.
Key Features
- Comprehensive DCI Data: Pre-filled with Donaldson Company’s historical financials and future projections.
- Fully Customizable Inputs: Modify revenue growth, profit margins, WACC, tax rates, and capital expenditures as needed.
- Dynamic Valuation Model: Automatic updates to Net Present Value (NPV) and intrinsic value based on user inputs.
- Scenario Testing: Generate various forecast scenarios to evaluate different valuation outcomes.
- User-Friendly Design: Intuitive, organized, and crafted for both professionals and novices.
How It Works
- Download the Template: Gain immediate access to the Excel-based DCI DCF Calculator.
- Input Your Assumptions: Modify the yellow-highlighted cells for growth rates, WACC, margins, and other parameters.
- Instant Calculations: The model automatically recalculates Donaldson Company's intrinsic value.
- Test Scenarios: Experiment with various assumptions to assess potential changes in valuation.
- Analyze and Decide: Utilize the results to inform your investment or financial decisions.
Why Choose This Calculator for Donaldson Company, Inc. (DCI)?
- Accuracy: Utilizes real Donaldson financials to ensure precise data.
- Flexibility: Tailored for users to easily test and adjust inputs.
- Time-Saving: Avoid the complexities of building a DCF model from the ground up.
- Professional-Grade: Crafted with the precision and usability expected by CFOs.
- User-Friendly: Intuitive design makes it accessible for those without extensive financial modeling skills.
Who Should Use This Product?
- Professional Investors: Develop comprehensive and accurate valuation models for investment analysis in Donaldson Company, Inc. (DCI).
- Corporate Finance Teams: Evaluate valuation scenarios to inform strategic decisions within their organizations.
- Consultants and Advisors: Deliver precise valuation insights to clients regarding Donaldson Company, Inc. (DCI).
- Students and Educators: Utilize real-world data to enhance learning and practice financial modeling techniques.
- Industry Analysts: Gain insights into how companies like Donaldson Company, Inc. (DCI) are assessed in the market.
What the Template Contains
- Comprehensive DCF Model: Editable template with detailed valuation calculations tailored for Donaldson Company, Inc. (DCI).
- Real-World Data: Donaldson's historical and projected financials preloaded for thorough analysis.
- Customizable Parameters: Adjust WACC, growth rates, and tax assumptions to explore different scenarios.
- Financial Statements: Complete annual and quarterly breakdowns for enhanced insights.
- Key Ratios: Integrated analysis for profitability, efficiency, and leverage metrics.
- Dashboard with Visual Outputs: Charts and tables designed for clear, actionable results.
Disclaimer
All information, articles, and product details provided on this website are for general informational and educational purposes only. We do not claim any ownership over, nor do we intend to infringe upon, any trademarks, copyrights, logos, brand names, or other intellectual property mentioned or depicted on this site. Such intellectual property remains the property of its respective owners, and any references here are made solely for identification or informational purposes, without implying any affiliation, endorsement, or partnership.
We make no representations or warranties, express or implied, regarding the accuracy, completeness, or suitability of any content or products presented. Nothing on this website should be construed as legal, tax, investment, financial, medical, or other professional advice. In addition, no part of this site—including articles or product references—constitutes a solicitation, recommendation, endorsement, advertisement, or offer to buy or sell any securities, franchises, or other financial instruments, particularly in jurisdictions where such activity would be unlawful.
All content is of a general nature and may not address the specific circumstances of any individual or entity. It is not a substitute for professional advice or services. Any actions you take based on the information provided here are strictly at your own risk. You accept full responsibility for any decisions or outcomes arising from your use of this website and agree to release us from any liability in connection with your use of, or reliance upon, the content or products found herein.