
|
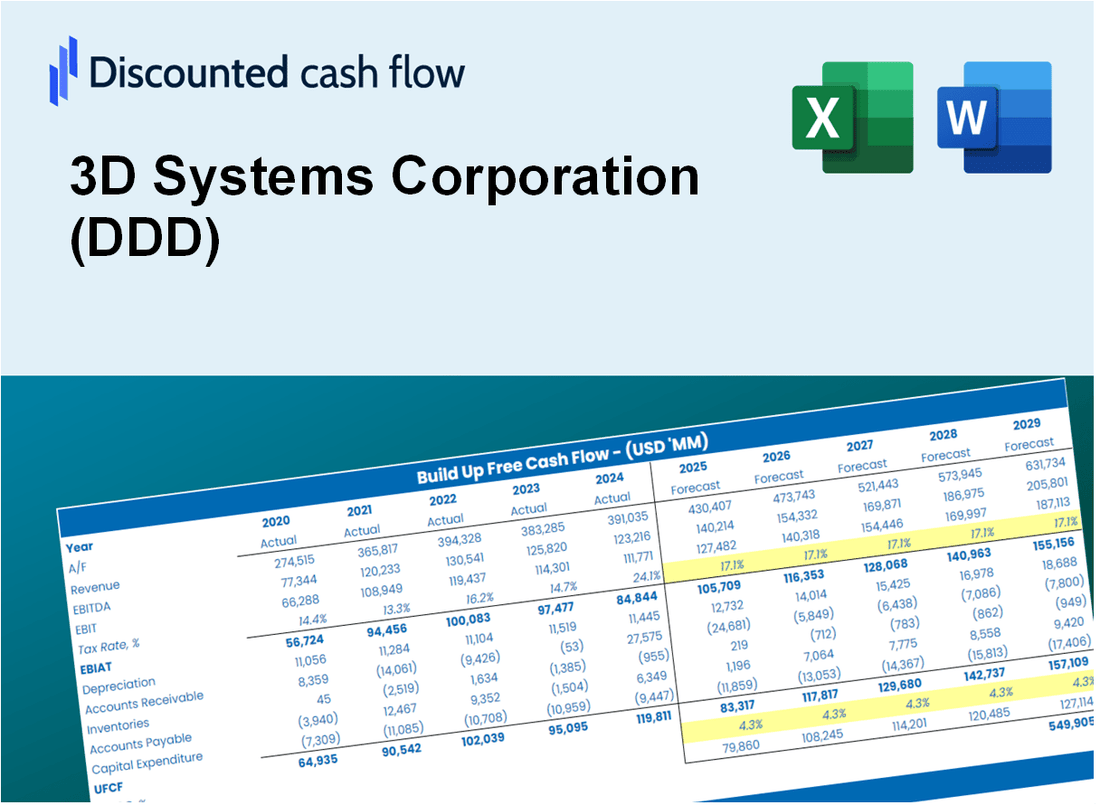
Valoración DCF de 3D Systems Corporation (DDD) |
Completamente Editable: Adáptelo A Sus Necesidades En Excel O Sheets
Diseño Profesional: Plantillas Confiables Y Estándares De La Industria
Predeterminadas Para Un Uso Rápido Y Eficiente
Compatible con MAC / PC, completamente desbloqueado
No Se Necesita Experiencia; Fáciles De Seguir
3D Systems Corporation (DDD) Bundle
¡Evalúe las perspectivas financieras de 3D Systems Corporation como un experto! Esta calculadora DCF (DDD) proporciona datos financieros preconsados y flexibilidad completa para modificar el crecimiento de los ingresos, WACC, los márgenes y otros supuestos esenciales para alinearse con sus proyecciones.
What You Will Get
- Real DDD Financials: Access historical and projected data for precise valuation.
- Customizable Inputs: Adjust WACC, tax rates, revenue growth, and capital expenditures as needed.
- Dynamic Calculations: Intrinsic value and NPV are computed in real-time.
- Scenario Analysis: Explore various scenarios to assess 3D Systems Corporation's future performance.
- User-Friendly Design: Designed for professionals while remaining easy to use for newcomers.
Key Features
- Comprehensive Data: 3D Systems Corporation’s historical financial statements and projected forecasts.
- Customizable Parameters: Adjust WACC, tax rates, revenue growth, and EBITDA margins as needed.
- Real-Time Calculations: View 3D Systems Corporation’s intrinsic value update instantly.
- Intuitive Visuals: Dashboard graphs showcase valuation outcomes and essential metrics.
- Designed for Precision: A reliable tool for analysts, investors, and financial professionals.
How It Works
- 1. Access the Model: Download and open the Excel file containing 3D Systems Corporation’s (DDD) preloaded data.
- 2. Adjust Variables: Modify key parameters such as growth estimates, WACC, and capital expenditures.
- 3. Analyze Results Immediately: The DCF model automatically computes intrinsic value and NPV.
- 4. Explore Scenarios: Evaluate various forecasts to assess different valuation possibilities.
- 5. Present with Assurance: Deliver professional valuation insights to back your strategic decisions.
Why Choose This Calculator for 3D Systems Corporation (DDD)?
- Accurate Data: Real financials from 3D Systems Corporation ensure dependable valuation outcomes.
- Customizable: Modify key parameters such as growth rates, WACC, and tax rates to align with your forecasts.
- Time-Saving: Pre-built calculations save you the hassle of starting from the ground up.
- Professional-Grade Tool: Tailored for investors, analysts, and consultants in the 3D printing sector.
- User-Friendly: An intuitive design and step-by-step guidance make it accessible for all users.
Who Should Use This Product?
- Individual Investors: Make informed decisions about buying or selling 3D Systems Corporation (DDD) stock.
- Financial Analysts: Streamline valuation processes with ready-to-use financial models for 3D Systems Corporation (DDD).
- Consultants: Deliver professional valuation insights on 3D Systems Corporation (DDD) to clients quickly and accurately.
- Business Owners: Understand how companies like 3D Systems Corporation (DDD) are valued to guide your own strategy.
- Finance Students: Learn valuation techniques using real-world data and scenarios involving 3D Systems Corporation (DDD).
What the Template Contains
- Comprehensive DCF Model: Editable template featuring intricate valuation calculations.
- Real-World Data: 3D Systems Corporation’s (DDD) historical and projected financials preloaded for analysis.
- Customizable Parameters: Modify WACC, growth rates, and tax assumptions to explore various scenarios.
- Financial Statements: Complete annual and quarterly breakdowns for enhanced insights.
- Key Ratios: Integrated analysis for profitability, efficiency, and leverage metrics.
- Dashboard with Visual Outputs: Charts and tables designed for clear, actionable results.
Disclaimer
All information, articles, and product details provided on this website are for general informational and educational purposes only. We do not claim any ownership over, nor do we intend to infringe upon, any trademarks, copyrights, logos, brand names, or other intellectual property mentioned or depicted on this site. Such intellectual property remains the property of its respective owners, and any references here are made solely for identification or informational purposes, without implying any affiliation, endorsement, or partnership.
We make no representations or warranties, express or implied, regarding the accuracy, completeness, or suitability of any content or products presented. Nothing on this website should be construed as legal, tax, investment, financial, medical, or other professional advice. In addition, no part of this site—including articles or product references—constitutes a solicitation, recommendation, endorsement, advertisement, or offer to buy or sell any securities, franchises, or other financial instruments, particularly in jurisdictions where such activity would be unlawful.
All content is of a general nature and may not address the specific circumstances of any individual or entity. It is not a substitute for professional advice or services. Any actions you take based on the information provided here are strictly at your own risk. You accept full responsibility for any decisions or outcomes arising from your use of this website and agree to release us from any liability in connection with your use of, or reliance upon, the content or products found herein.