
|
Valoración de DCF de la Compañía de Energía Diversificada (Dec.L) |
Completamente Editable: Adáptelo A Sus Necesidades En Excel O Sheets
Diseño Profesional: Plantillas Confiables Y Estándares De La Industria
Predeterminadas Para Un Uso Rápido Y Eficiente
Compatible con MAC / PC, completamente desbloqueado
No Se Necesita Experiencia; Fáciles De Seguir
Diversified Energy Company PLC (DEC.L) Bundle
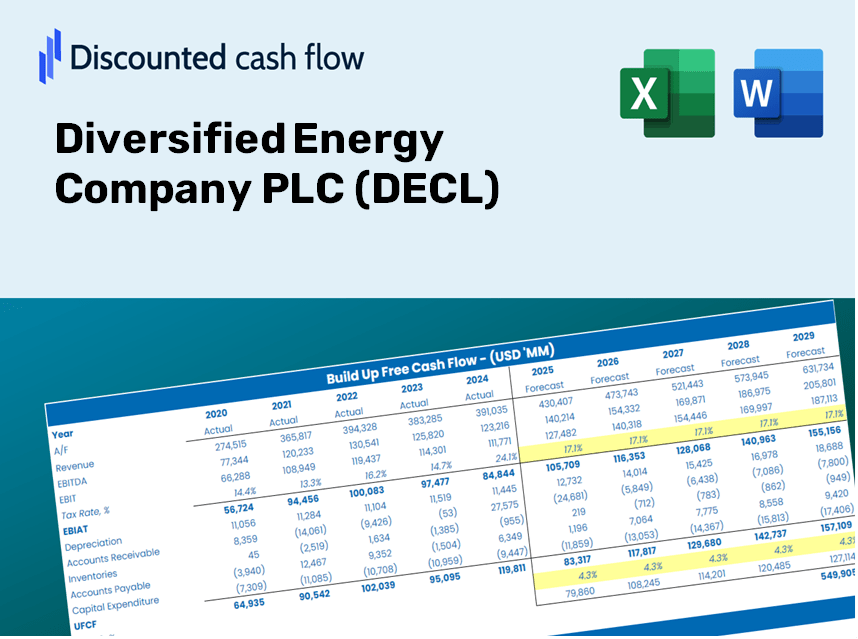
¡Mejore sus opciones de inversión con la calculadora DCF (Decl)! Explore los datos financieros auténticos de la compañía de energía diversificada PLC, ajuste las predicciones y gastos de crecimiento, y observe instantáneamente cómo estos cambios afectan el valor intrínseco de (Dec).
Discounted Cash Flow (DCF) - (USD MM)
| Year | AY1 2020 |
AY2 2021 |
AY3 2022 |
AY4 2023 |
AY5 2024 |
FY1 2025 |
FY2 2026 |
FY3 2027 |
FY4 2028 |
FY5 2029 |
|---|---|---|---|---|---|---|---|---|---|---|
| Revenue | 310.8 | 766.3 | 1,459.7 | 660.3 | 604.5 | 796.9 | 1,050.4 | 1,384.6 | 1,825.2 | 2,406.0 |
| Revenue Growth, % | 0 | 146.53 | 90.49 | -54.76 | -8.46 | 31.82 | 31.82 | 31.82 | 31.82 | 31.82 |
| EBITDA | 17.7 | -253.0 | -362.4 | 1,033.6 | 129.4 | 110.4 | 145.5 | 191.8 | 252.8 | 333.3 |
| EBITDA, % | 5.69 | -33.02 | -24.83 | 156.53 | 21.41 | 13.85 | 13.85 | 13.85 | 13.85 | 13.85 |
| Depreciation | 89.2 | 127.5 | 169.0 | 170.8 | 195.1 | 183.4 | 241.7 | 318.6 | 420.0 | 553.6 |
| Depreciation, % | 28.7 | 16.64 | 11.58 | 25.86 | 32.27 | 23.01 | 23.01 | 23.01 | 23.01 | 23.01 |
| EBIT | -71.5 | -380.5 | -531.4 | 862.8 | -65.6 | -31.8 | -41.9 | -55.2 | -72.7 | -95.9 |
| EBIT, % | -23 | -49.66 | -36.41 | 130.66 | -10.86 | -3.99 | -3.99 | -3.99 | -3.99 | -3.99 |
| Total Cash | 1.0 | 9.6 | 5.6 | 2.9 | 4.6 | 5.0 | 6.6 | 8.7 | 11.5 | 15.2 |
| Total Cash, percent | .0 | .0 | .0 | .0 | .0 | .0 | .0 | .0 | .0 | .0 |
| Account Receivables | 50.9 | 215.2 | 225.7 | 144.7 | 178.3 | 177.4 | 233.9 | 308.3 | 406.4 | 535.7 |
| Account Receivables, % | 16.39 | 28.08 | 15.46 | 21.91 | 29.49 | 22.27 | 22.27 | 22.27 | 22.27 | 22.27 |
| Inventories | 4.8 | 7.2 | 7.0 | 6.0 | 7.3 | 8.1 | 10.7 | 14.0 | 18.5 | 24.4 |
| Inventories, % | 1.55 | 0.93731 | 0.48074 | 0.90169 | 1.21 | 1.01 | 1.01 | 1.01 | 1.01 | 1.01 |
| Accounts Payable | 14.6 | 46.9 | 68.8 | 37.6 | 159.3 | 75.8 | 100.0 | 131.8 | 173.7 | 229.0 |
| Accounts Payable, % | 4.7 | 6.11 | 4.71 | 5.7 | 26.35 | 9.52 | 9.52 | 9.52 | 9.52 | 9.52 |
| Capital Expenditure | -18.9 | -38.2 | -65.5 | -56.5 | -39.6 | -48.8 | -64.4 | -84.9 | -111.9 | -147.5 |
| Capital Expenditure, % | -6.08 | -4.98 | -4.48 | -8.55 | -6.55 | -6.13 | -6.13 | -6.13 | -6.13 | -6.13 |
| Tax Rate, % | 60.58 | 60.58 | 60.58 | 60.58 | 60.58 | 60.58 | 60.58 | 60.58 | 60.58 | 60.58 |
| EBITAT | -12.3 | -224.6 | -415.7 | 653.8 | -25.9 | -17.1 | -22.6 | -29.8 | -39.2 | -51.7 |
| Depreciation | ||||||||||
| Changes in Account Receivables | ||||||||||
| Changes in Inventories | ||||||||||
| Changes in Accounts Payable | ||||||||||
| Capital Expenditure | ||||||||||
| UFCF | 16.9 | -269.7 | -300.6 | 819.1 | 216.3 | 34.0 | 119.8 | 158.0 | 208.2 | 274.5 |
| WACC, % | 2.91 | 5.38 | 6.51 | 6.36 | 4.22 | 5.08 | 5.08 | 5.08 | 5.08 | 5.08 |
| PV UFCF | ||||||||||
| SUM PV UFCF | 662.0 | |||||||||
| Long Term Growth Rate, % | 0.50 | |||||||||
| Free cash flow (T + 1) | 276 | |||||||||
| Terminal Value | 6,025 | |||||||||
| Present Terminal Value | 4,703 | |||||||||
| Enterprise Value | 5,365 | |||||||||
| Net Debt | 1,317 | |||||||||
| Equity Value | 4,048 | |||||||||
| Diluted Shares Outstanding, MM | 48 | |||||||||
| Equity Value Per Share | 8,511.72 |
Benefits You Will Receive
- Adjustable Forecast Parameters: Effortlessly modify assumptions (growth %, profit margins, WACC) to explore various scenarios.
- Comprehensive Data: Pre-filled financial data for Diversified Energy Company PLC (DECL) to enhance your analysis.
- Automated DCF Calculations: The template computes Net Present Value (NPV) and intrinsic value automatically.
- Customizable and Professional Design: A well-crafted Excel model tailored to meet your valuation preferences.
- Designed for Analysts and Investors: Perfect for evaluating forecasts, confirming strategies, and optimizing efficiency.
Core Advantages
- Customizable Forecast Parameters: Adjust essential metrics such as revenue growth, EBITDA %, and capital expenditures.
- Instant DCF Valuation: Automatically computes intrinsic value, NPV, and other key outputs.
- High-Precision Accuracy: Leverages real-world financial data from Diversified Energy Company PLC (DECL) for reliable valuation results.
- Simplified Scenario Analysis: Effortlessly explore various assumptions and evaluate outcomes.
- Efficiency-Boosting Tool: Avoid the hassle of constructing intricate valuation models from the ground up.
How It Works
- Step 1: Download the Excel file.
- Step 2: Review the pre-populated data for Diversified Energy Company PLC (DECL) including historical and projected figures.
- Step 3: Modify key assumptions in the highlighted yellow cells according to your analysis.
- Step 4: Observe the automatic recalculations reflecting the intrinsic value of Diversified Energy Company PLC (DECL).
- Step 5: Utilize the results for your investment decisions or reporting needs.
Why Choose the Diversified Energy Company PLC (DECL) Calculator?
- Time Efficiency: Skip the hassle of building a DCF model from the ground up – it’s ready for immediate use.
- Enhanced Precision: Access to dependable financial data and formulas minimizes valuation errors.
- Completely Customizable: Adjust the model to suit your specific assumptions and forecasts.
- User-Friendly: Intuitive charts and outputs simplify result analysis.
- Preferred by Professionals: Crafted for experts who prioritize accuracy and ease of use.
Who Can Benefit from This Product?
- Finance Students: Master valuation methods and apply them using real-world data pertaining to Diversified Energy Company PLC (DECL).
- Academics: Integrate industry-standard models into your teaching or research related to energy markets.
- Investors: Validate your investment hypotheses and analyze valuation metrics for Diversified Energy Company PLC (DECL).
- Analysts: Enhance your efficiency with a customizable DCF model tailored for energy sector analysis.
- Small Business Owners: Discover how major public companies like Diversified Energy Company PLC (DECL) are evaluated in the market.
Contents of the Template
- Preloaded DECL Data: Historical and projected financial metrics, including revenue, EBIT, and capital expenditures.
- DCF and WACC Models: Professional spreadsheets designed for calculating intrinsic value and Weighted Average Cost of Capital.
- Editable Inputs: Yellow-highlighted cells for modifying revenue growth, tax rates, and discount rates.
- Financial Statements: Detailed annual and quarterly financial reports for in-depth analysis.
- Key Ratios: Ratios assessing profitability, leverage, and efficiency to evaluate overall performance.
- Dashboard and Charts: Visual representations of valuation results and underlying assumptions.
Disclaimer
All information, articles, and product details provided on this website are for general informational and educational purposes only. We do not claim any ownership over, nor do we intend to infringe upon, any trademarks, copyrights, logos, brand names, or other intellectual property mentioned or depicted on this site. Such intellectual property remains the property of its respective owners, and any references here are made solely for identification or informational purposes, without implying any affiliation, endorsement, or partnership.
We make no representations or warranties, express or implied, regarding the accuracy, completeness, or suitability of any content or products presented. Nothing on this website should be construed as legal, tax, investment, financial, medical, or other professional advice. In addition, no part of this site—including articles or product references—constitutes a solicitation, recommendation, endorsement, advertisement, or offer to buy or sell any securities, franchises, or other financial instruments, particularly in jurisdictions where such activity would be unlawful.
All content is of a general nature and may not address the specific circumstances of any individual or entity. It is not a substitute for professional advice or services. Any actions you take based on the information provided here are strictly at your own risk. You accept full responsibility for any decisions or outcomes arising from your use of this website and agree to release us from any liability in connection with your use of, or reliance upon, the content or products found herein.