
|
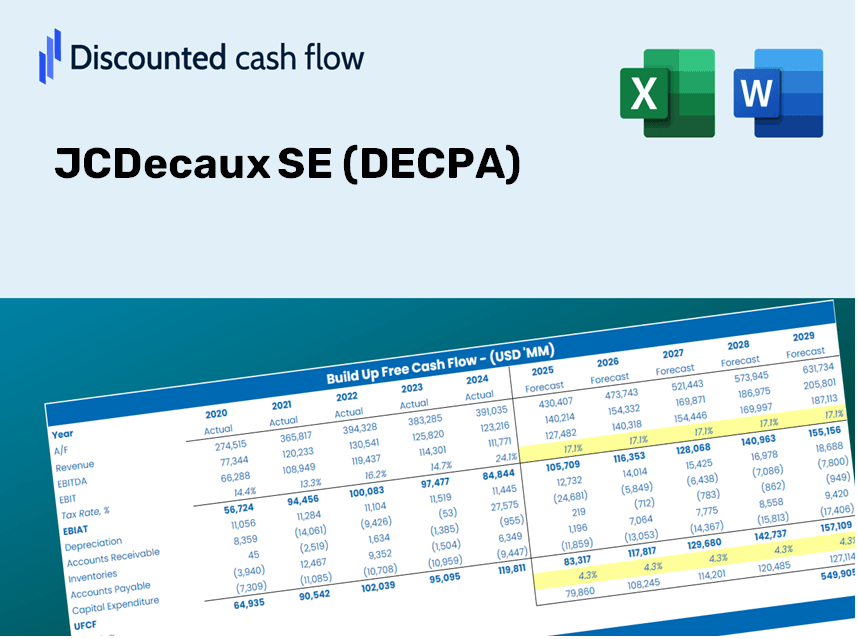
JCDECAUX SE (dic. PA) Valoración de DCF |
Completamente Editable: Adáptelo A Sus Necesidades En Excel O Sheets
Diseño Profesional: Plantillas Confiables Y Estándares De La Industria
Predeterminadas Para Un Uso Rápido Y Eficiente
Compatible con MAC / PC, completamente desbloqueado
No Se Necesita Experiencia; Fáciles De Seguir
JCDecaux SE (DEC.PA) Bundle
¡Evalúe la perspectiva financiera de JCDECAUX SE como un experto! Esta calculadora DCF (DECPA) proporciona datos financieros preconsados y ofrece flexibilidad total para modificar el crecimiento de los ingresos, WACC, los márgenes y otros supuestos esenciales para alinearse con sus proyecciones.
What You Will Receive
- Genuine JCDecaux Financial Data: Pre-populated with historical and forecasted information for accurate analysis.
- Customizable Template: Easily adjust key parameters such as revenue growth, WACC, and EBITDA margin.
- Instant Calculations: Observe real-time updates of JCDecaux’s intrinsic value as you make modifications.
- Professional Valuation Tool: Tailored for investors, analysts, and consultants in pursuit of precise DCF outcomes.
- Intuitive Design: User-friendly structure and straightforward instructions suitable for all skill levels.
Key Features
- Pre-Loaded Data: JCDecaux SE’s historical financial statements and pre-filled forecasts.
- Fully Adjustable Inputs: Customize WACC, tax rates, revenue growth, and EBITDA margins.
- Instant Results: View JCDecaux SE’s intrinsic value recalculated in real-time.
- Clear Visual Outputs: Dashboard charts showcase valuation results and key metrics.
- Built for Accuracy: A professional tool tailored for analysts, investors, and finance professionals.
How It Operates
- Download: Access the pre-built Excel file featuring JCDecaux SE’s financial data.
- Customize: Tailor forecasts, including revenue growth, EBITDA %, and WACC to fit your analysis.
- Update Automatically: Calculate intrinsic value and NPV that refresh in real-time.
- Test Scenarios: Develop various projections and swiftly compare the results.
- Make Decisions: Leverage the valuation findings to shape your investment strategy.
Why Opt for This Calculator?
- Designed for Experts: A sophisticated tool utilized by analysts, CFOs, and consultants in the field.
- Accurate Data: JCDecaux SE's (DECPA) historical and forecasted financials included for precision.
- Forecast Simulation: Effortlessly test various scenarios and assumptions.
- Comprehensive Outputs: Instantly computes intrinsic value, NPV, and essential metrics.
- User-Friendly: Step-by-step guidance simplifies the entire calculation process.
Who Can Benefit from This Product?
- Investors: Assess JCDecaux SE's (DECPA) valuation before making stock trades.
- CFOs and Financial Analysts: Optimize valuation methods and evaluate financial forecasts.
- Startup Founders: Understand the valuation strategies of prominent public companies like JCDecaux SE.
- Consultants: Create detailed valuation reports for your clients based on JCDecaux SE.
- Students and Educators: Utilize real data to practice and instruct on valuation methodologies.
Overview of the Template's Features
- Detailed DCF Model: An editable template featuring comprehensive valuation calculations.
- Real-Time Data: JCDecaux SE's (DECPA) historical and forecasted financials are preloaded for analysis.
- Adjustable Parameters: Modify WACC, growth rates, and tax assumptions to explore different scenarios.
- Financial Statements: Complete annual and quarterly breakdowns for in-depth analysis.
- Key Financial Ratios: Integrated analysis for profitability, efficiency, and leverage metrics.
- Interactive Dashboard with Visual Outputs: Charts and tables that provide clear and actionable insights.
Disclaimer
All information, articles, and product details provided on this website are for general informational and educational purposes only. We do not claim any ownership over, nor do we intend to infringe upon, any trademarks, copyrights, logos, brand names, or other intellectual property mentioned or depicted on this site. Such intellectual property remains the property of its respective owners, and any references here are made solely for identification or informational purposes, without implying any affiliation, endorsement, or partnership.
We make no representations or warranties, express or implied, regarding the accuracy, completeness, or suitability of any content or products presented. Nothing on this website should be construed as legal, tax, investment, financial, medical, or other professional advice. In addition, no part of this site—including articles or product references—constitutes a solicitation, recommendation, endorsement, advertisement, or offer to buy or sell any securities, franchises, or other financial instruments, particularly in jurisdictions where such activity would be unlawful.
All content is of a general nature and may not address the specific circumstances of any individual or entity. It is not a substitute for professional advice or services. Any actions you take based on the information provided here are strictly at your own risk. You accept full responsibility for any decisions or outcomes arising from your use of this website and agree to release us from any liability in connection with your use of, or reliance upon, the content or products found herein.